When it comes to analytics, I am a big fan of pan-session analysis. Pan-session analysis provides insights across multiple visits by the same person. For almost every website it is an incredibly, powerful way to understand your visitors better.
By applying the insights you derive from this analysis, you can further optimize your visitor’s experience and conversion rate.
In the following paragraphs I will describe five different pan-session analysis techniques that deliver great insights.
- Frequency and recency analysis
- Time and visits to purchase analysis
- Pan-session funnel analysis
- Multichannel analysis
- Customer analysis
Let’s start with frequency and recency reporting.
1. Frequency And Recency Analysis
Frequency and recency metrics and distributions show you how loyal your audience actually is. Do your visitors only come once and never return? Or do you have a great deal of visitors who come to your website even more than three times a week?
Let’s take a closer look at two reports. First, the ‘count of visits’ report, which shows the frequency of visitors (direct link to report):
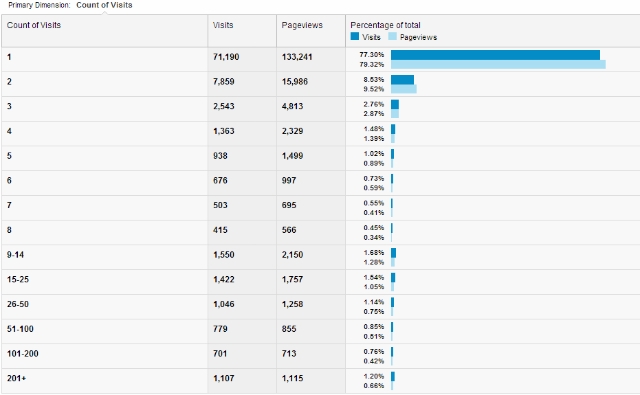
Almost 80% of the visitors to this website visit the website just once and don’t come again. That doesn’t look very good. Let’s dive into the recency metric, in the ‘days since last visit’ report (go to this report and click on ‘days since last visit’ tab).
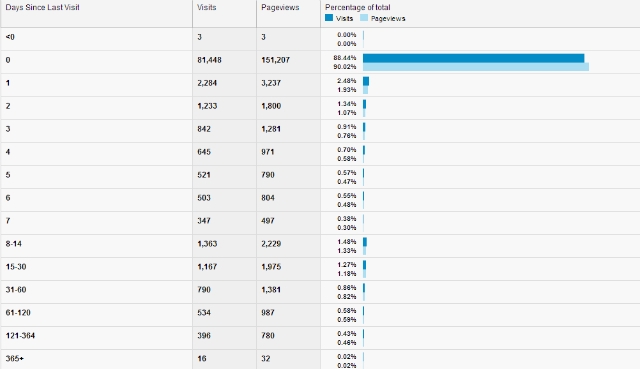
The recency graph on itself doesn’t look bad. Almost 90% of the visitors visited the website within the last day. But, we have to subtract the new visitors to get a good overview of the returning visitors percentage and how often they visit the site.
With the combined overview of recency and frequency metrics I would conclude that this website really needs to invest in building a stable base of loyal subscribers / visitors.
Posting new content (a blog?) and offers on a more regular base would definitely help to keep the visitors engaged with this website.
2. Visits And Time to Purchase Analysis
In order to find out more about the product buying decision cycle, the visits and time to purchase reports deliver very useful information. You can find these reports in the E-commerce module of Google Analytics (if you have E-commerce implemented, here is a direct link to report). An example of a “Visits to Purchase” report is shown below:
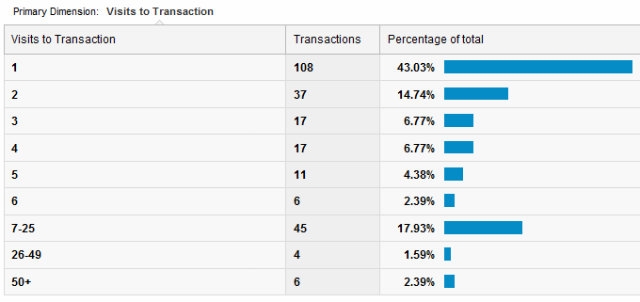
In this case roughly 40% of the visitors convert within the first visit and 70% needs one to four visits to come to a buying decision. Wow, 20% of the conversions on this website take place after seven or more visits. What’s happening here?
A lot of websites contain landing pages that are too much focused on making a direct sale. It is extremely important to segment your visitors and apply different tactics to make them convert. The “time to purchase” data shows a similar distribution as we saw earlier:
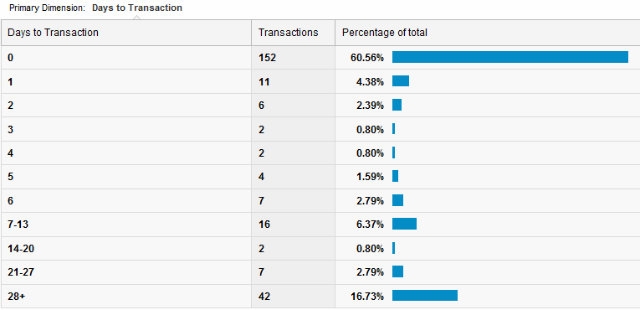
Now it’s time to segment your data further and find out which visitors convert the highest (visitors from a geographical region, certain campaign traffic, etc.) and which visitors don’t. You can use different strategies for each visitor segment.
3. Funnels: Pan-Session Analysis
A conversion funnel is a graphical report representing a series of steps that a user must take in order to convert. The conversion could be anything from purchase to sign-up, subscribe to newsletter, watch a demo etc.
Google Analytics and many other web analytics tools do have funnel capabilities, but they lack certain functionality:
- The possibility to measure across different sessions
- The possibility to segment the funnel data
This is where a tool called Paditrack can help. It’s free and delivers great insights in how your visitors are flowing through your funnels in multiple sessions.
4. Multichannel Analysis
Google Analytics provides you with an amazing opportunity to capture and analyze pan-session behavior using their multichannel reporting interface. Very often your website visitors won’t convert in their first visit.
In the report below, the ‘top conversion paths’ (direct link to report) you can see the distribution of the top 10 conversion paths of an E-commerce website:
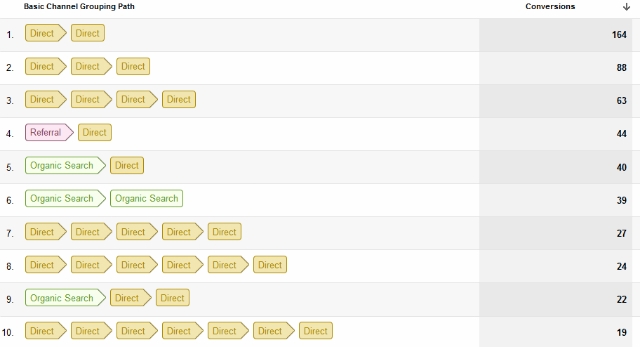
In this particular case website visitors tend to come back very often before they decide to purchase. It is a challenge to try to optimize your conversion with the help of multichannels, but it is more than worth it to put in the effort!
Think about redistributing your online budget based on how your different marketing channels perform in the customer journey. Here are some analysis ideas based on this feature.
5. Customer Analysis
With Google Analytics custom variables, you can define extra segments to apply to your visitors. In one word you could name it “labeling”. Custom variables can be set on three different levels:
- Page level
- Visit level
- Visitor level
In order to do pan-session analysis we need to set the custom variable at the visitor level. Here you can find technical instructions on how to implement custom variables.
By setting a custom variable on the visitor level, we can follow our website visitors through multiple sessions.
So let’s assume I run an E-commerce site and I am interested in the behavior of customers. In this case I define a customer as someone who made an earlier purchase on my website.
I can analyze the the behavior of this segment by simply setting a custom variable on the thank you page after an order is placed. By doing this I can analyze:
- The behavior of website visitors who placed an order in the past
- The behavior of website visitors who didn’t place an order before
You can set custom variables on visitors who sign up through a lead generation form, log in as a member, donate money to your charity etc. Please remember that if you set the custom variable per visitor, you cannot use Personal Identifiable Information, it is against Google Analytics ToS.
Last Remarks
The deletion of cookies and people accessing your site through multiple devices and browsers (tabs) will affect your pan-session analysis. If you are interested in learning more about measuring across multiple devices and browsers, you should read: Google Universal Analytics: A User-Centric Approach.
Paul Koks is the owner and editor of OnlineMetrics, a blog about Analytics and Conversion Optimization. You can follow him on Twitter @OnlineMetrics or connect on LinkedIn.


