So, you are amazed at how Amazon personalizes their customer experience. And you have read article after article on how effective 1-to-1 marketing can be. Yet, when you review your own marketing initiatives, there is suddenly that realization that this personalization element is totally missing. When assessing your current digital marketing initiatives, you may find the following.
You are doing well at
- Your paid search campaigns, you are targeting searchers at various stages of the buying cycle with relevant ad copy and landing pages.
- Your e-mail lists are well segmented into leads and customers.
- Your media buys are very targeted to sites with visitors with affinity for your products.
- You have your analytics in order and your reporting in place for your campaign performance, site engagement and ecommerce.
You are not doing so well at
- You have little or no visibility into the behavior of repeat members and buyers.
- You have no idea how your customers interact across your different platforms (website, mobile, in-store, loyalty cards, etc.)
- The user-centric view of your customers (that you fantasized about after finishing your MBA) is a bit harder to get than you thought.
Google Analytics – User Centric Analytics
Whether you are doing great in some areas and poorly in others, there is always room for improvement. And having the ability to understand how users engage with your content across various devices, platforms, etc. is important. Focusing on creating a user-centric environment will vastly improve your 1-to-1 marketing with customers.
According to Google, their analytics platform “…provides tools that allows you to measure your effectiveness in advertising, sales, product development and retention across all your touchpoints.” With the help of Google Analytics, reaching that user-centric environment isn’t that hard to do!
In this post, I hope to shed some light on applying the user-centric concept to your online retail business. Note: this post is not meant to be a technical guide. For the technical implementation details, please refer to this article. I’ll examine the four following scenarios:
1. One Visitor – Multiple Browsers
2. One Visitor – Multiple Devices
3. Visitors Buying Cycle Stages
4. Online and Offline Purchases
Let’s get started!
1. One Visitor – Multiple Browsers
I don’t know about you, but when I’m at work, not only do I have many tabs open on my default Chrome browser, I have at least two other browsers running at any given time. Then, when I get home, I grab a laptop to browse and shop, while watching TV. Now, to web analytics, all of these visits from the various browsers and computers look like different users, when in reality, it’s just yours truly. It turns out I’m not the only one with this “multiple” browsing behavior. It’s actually quite common these days. So how do retailers know if it’s me, or multiple users? Let’s examine this closely on the online retailer end of things.
Look at the snapshot below. This is a Google Analytics report for ecommerce, and is segmented by browser. You can see what appears to have three transactions that come from three different visitors (browsers). However, when you look at the first column with the unique customer ID, you’ll notice the three transactions come from the same visitor.

For the site shown above, registration is required before you browse products and get exclusive offers. (And once the site owner has your email, you can rest assured that you’ll receive “amazing deals” in your inbox going forward :-). This retailer has done his homework and knows how to create a unique ID for each visitor, and stores a Custom Variable which enabled us to stitch together the visits and get this new “user-centric” perspective. Now going forward, Universal Analytics Measurement Protocol will be our best friend!
What other insights can be derived? One of the KPIs for this retailer is the time elapsed between a customer registration and the first purchase. As you can see here, this visitor registered on September 19th, and they had 27 visits and then two transactions.

For the visitor below, this graph shows that it took 12 visits before the first transaction (and then just three visits before the second transaction).

With this type of visitor-level data that is now available, you can easily map the registration dates to the transaction dates and you’ll have full visibility into the buying cycle. Now, you have the ability to use this information to your advantage and find creative marketing messages and offers that may help shorten the buying cycle. Plus, you can reach out to those who are not buying (and run all sorts of Lifetime Value analyses, cohort, RFM and others).
2. One Visitor – Multiple Devices
Another powerful use case for user-centric analysis is the ability to stitch together data across different devices, including mobile devices. One of the challenges for the site owner mentioned above is measuring campaign and site performance for users who are accessing the sites from mobile device, tablets and desktops.
Let’s say you have visited their “Exclusive Offers” site on your desktop, you registered and now have an account. But, you decide not to buy now and want to wait for an “End of Year” special. Later, you are presented with a mobile ad with that special you’ve been waiting for. So you click on the ad.
Unfortunately, the site owner again requires you to sign up or sign in. Since you already have an account, you simply sign in. Without applying the user-centric concept discussed previously, this visitor will appear as a different user. You wouldn’t be able to tell if the same person registered on one device, and then bought on another. Nor will you be able to report on their total purchase across devices.
Examine the screenshot below. Here, you see how the user-centric concept is being put to work. The user visited on mobile, and then visited on non-mobile as well. Again, this is super insightful, since you see the full buying cycle and activities across devices.

3. Visitors Buying Cycle Stages
Following the same ecommerce model (sites with exclusive offers that require logins and assigns user IDs to customers), you may want to consider taking it a step further and create your own user segmentation “flow”. Start off with members (those who registered), then returning members and then buyers.
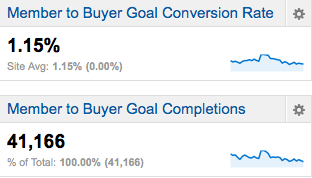
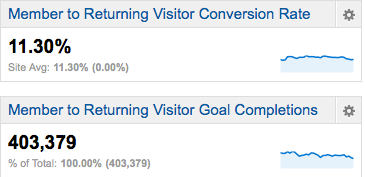
Look at the site references below. Instead of just reporting on some aggregate conversion rate (that looks ok but is really useless), the site owner can create this amazing view/funnel of the user segments and the associated conversion rates of moving from one customer segment to another.
Site visitors who become members (and now you know what drives more membership).

Then build a report on returning members and see what keeps them coming.

And last but not least, you can measure the true conversion rate of members to buyers.

4. Online and Offline Purchases
Another use case for Universal Analytics and user-centric analytics is integrating offline purchases with your online Web Analytics data. Depending on your environment, you might want to do the integration in your own database or data warehouse, but that’s for another discussion. In this use case, we want to show how to bring this data into Google Analytics.
Let’s take, for example, a retailer that accepts orders over the phone, in addition to online sales. During this process, the sales rep logs in the client info, orders the product(s), takes the credit card and then processes the transaction.
Here is how we now can tie it all together: when the client calls and is authenticated, a hit is registered and is associated with the client’s unique ID in analytics. When the sales rep completes the transaction, the associated ecommerce transaction data is registered in analytics as well.

Since we assigned a unique ID for each transaction, we can later report on the visitor’s purchases whether they completed the purchase online or offline. Again, the 360 view is completed.
This approach can be extended to include point-of-sale transactions in-store or from mobile apps and data loyalty programs. Each can be integrated in the mix.
Closing Thoughts
As you can see, user-centric analytics can be extremely helpful. It can tell you a lot about your visitors. But, it can go beyond that to tell you more in-depth information about their visits and their habits. It essentially gives you an overview of their behavior, which in turn, provides you with a better understanding of your customers.
Do you feel you have a solid understanding of your online visitors and customers? If you’re a site owner or marketer, maybe it’s time to evaluate what user-centric approach you’re using, and see if they are being used to the full advantage. Identify what types of users and segments you have, and create a measurement plan that can give you a complete 360 degree view.


