In my last post I wrote about visualizing Google Analytics data using Fusion Tables. However, the method I used to export data from GA into Fusion Tables was very manual. A few days after publishing, Sreeram Balakrishnan, a colleague at Google, wrote me a note suggesting me to use an App Script to automate the process.
Sreeram went on to write the Script to populate Google Analytics data into Fusion Tables. Apart from making the process easier and cleaner, it allows doing some interesting things, such as updating the data daily using a trigger. In this article I provide a step-by-step guide on how to use the Script to get the data.
But if you prefer watching videos, here is a quick video guide.
Creating and Tweaking the App Script
First of all, create your own App Script, either by Making a copy of this file or by copy/pasting the script in the end of this article into a new project on https://script.google.com. Both ways will have the same result.
Once you create your Script, you will need to make only one change: search for var profileId = xxxxxxxx; and instead of xxxxxxxx you should add the View ID of the the View (profile) that you would like to use. In order to find your View ID, log in to Google Analytics and click on Admin on the top of the page; then click on View Settings of the View you want to export data from. Here is a screenshot showing how to get there:

Tip for Pros
If you are into playing with the Google Analytics API, keep reading this section; if not, just skip to the next section (Advanced Google Services & Google Developers Console).
As you will notice if you take a quick look at the Script, you can tweak it to export the Dimensions and Metrics you are most interested in. Here is the snippet that you can play with to change the data that goes into your Fusion Table. In the original Script I used Visits, Average Time on Site and E-Commerce Transactions aggregated by country.
var metric = 'ga:visits,ga:avgTimeOnSite,ga:transactions';

  var options = {

    dimensions: 'ga:country',

    sort: '-ga:visits',

    maxResults: 500

  };
Advanced Google Services & Google Developers Console
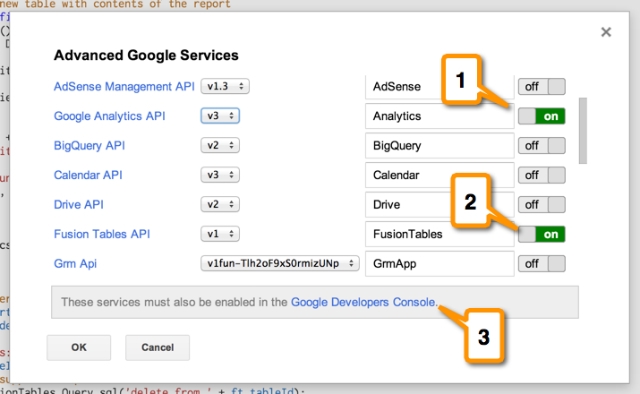
Once you make the change above, you should make sure that the Script has access to the services needed. On your Script page, click on the top menu named Resources and then on Advanced Google Services. You will see the page below. Make sure to turn on the Google Analytics API and Fusion Tables API and then click on Google Developers Console.

When you land in the Google Developers Console (after clicking on step #3 above) you need to turn on the Analytics API and Fusion Tables API.
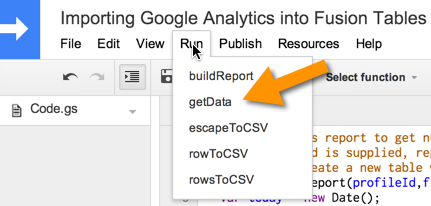
Now everything is ready to run the report. Here is how to run it:

Your table will be created and added to your Google Drive. Head on to your Google Drive recent files and make sure to click on the arrow on the top right corner of the list and change it to Last Modified.
You will find your new table there, enjoy!
Refetching the Data or Automating its Refreshing Rate
Above I explained how to run the Script for the first time, where the Script will create a new table for the data. However, you might be interested in updating the data from time to time. In order to do that, after you run it for the first time, go to your newly created table, click on File > About this table and copy the table Id.
Once you have the table Id, go back to your Script and search for var ft_tableId = ”; – add the Id inside the apostrophes. Now, every time you click on getData it will re-populate your table with the updated data.
If you really want to build an automated solution, you can add a trigger to update your data every day without having to do it manually. Here is more information on how to set up such a trigger.
App Script to Export Google Analytics Data to Fusion Table
// Run Analytics report to get num views broken down by country

// If ft_tableId is supplied, replace contents with output of report

// otherwise create a new table with contents of the report

function buildReport(profileId,ft_tableId) {

  var today = new Date();

  var oneWeekAgo = new Date(today.getTime() - 7 * 24 * 60 * 60 * 1000);
var startDate = Utilities.formatDate(oneWeekAgo, Session.getTimeZone(),
'yyyy-MM-dd');
var endDate = Utilities.formatDate(today, Session.getTimeZone(),
'yyyy-MM-dd');
var tableId = 'ga:' + profileId;
var metric = 'ga:visits,ga:percentNewVisits,ga:avgTimeOnSite';
var options = {
dimensions: 'ga:country',
sort: '-ga:visits',
maxResults: 500
};
var report = Analytics.Data.Ga.get(tableId, startDate, endDate, metric,
options);
if (report.rows) {
// Append the headers.
var headers = report.columnHeaders.map(function(columnHeader) {
return columnHeader.name;
});
Logger.log('Headers: %s', headers);
if (typeof ft_tableId === 'string' && ft_tableId.length == 40) {
// Fusion Table supplied. Replace contents
var result = FusionTables.Query.sql('delete from ' + ft_tableId);
Logger.log("deleted %s rows from table %s",result,ft_tableId);
Utilities.sleep( 1000);
var rowsAsCSV = Utilities.newBlob( rowsToCSV( report.rows),'application/octet-stream');
return FusionTables.Table.importRows(ft_tableId, rowsAsCSV);
} else {
// No table specified create a new table
report.rows.unshift(headers);
var rowsAsCSV = Utilities.newBlob( rowsToCSV( report.rows),'application/octet-stream');
return FusionTables.Table.importTable('Report for '+tableId, rowsAsCSV);
}
}
}
function getData () {
var profileId = xxxxxxxx;
var ft_tableId = '';
var result = buildReport( profileId, ft_tableId);
Logger.log("result of report is %s",result);
}
// Apply CSV escaping to single cell value
function escapeToCSV( value) {
var svalue = typeof(value) === 'string' ? value : value.toString();
if (svalue.indexOf(',') != -1 || svalue.indexOf("\n") != -1) {
return '"'+svalue.replace(/"/g,'""')+'"';
}
else {
return svalue;
}
}
// Convert single row to CSV
function rowToCSV( row) {
return row.map(escapeToCSV).join(",");
}
// Convert array of rows to csv
function rowsToCSV( rows) {
return rows.map(rowToCSV).join("\n");
}


