Table filters are a very powerful feature in Google Analytics. They allow you to perform deep analysis from within the interface. From experience, I can say that many Google Analytics users don’t know how to effectively use this feature, a missed opportunity for sure!
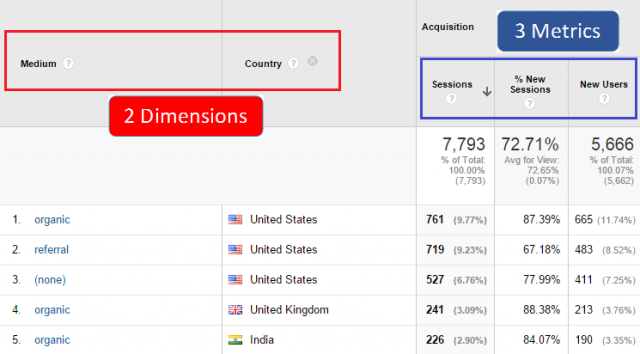
Most reports in Google Analytics contain one dimension and several metrics by default. However, it is easy to add a secondary dimension to your report, as seen in the screenshot below. And table filters really help you to slice and dice through your reports and their building stones – metrics and dimensions – in a more efficient way.

In this article I will guide you through table filters and a few related topics.
View Filters vs. Table Filters
I would like you to understand the basic concepts first, this will make it easier to get the complete picture.
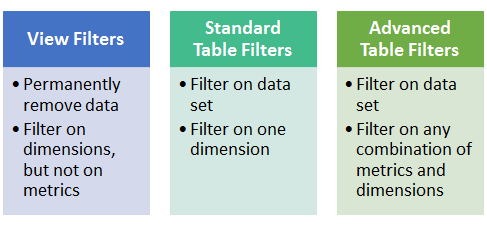
View filters are applied before the Google Analytics data is saved in your account. They are set up in the Admin interface and will apply to all data in the view, forever. I won’t go into much detail and examples about view filters here. Read this guide to Google Analytics filters for in-depth information on view filters.
Table filters work in a different way, they are ad-hoc segmentation filters. Contrary to view filters, these filters don’t permanently affect any data from your reporting view. You can think of it as filters in Excel. There are two types of table filters:
- Standard table filters allow you to filter data for the first dimension in your report and this can sometimes be limiting.
- Advanced table filters are more powerful as they allow you to filter on all available dimensions and metrics in your report.
By now you understand the difference between the different filter types that are available in Google Analytics, here is a quick overview.

A good knowledge of regular expressions is very handy when working with both filter types. I recommend learning at least the basics.
Filtering Standard Reports with Advanced Table Filters
Below I discuss how to create advanced table filters on Google Analytics.
1. Click on the advanced link to the left of the search field
![]()
2. Choose your filter

- First level: include or exclude
- Second level: dimension or metric
- Third level: matching type
- Fourth level: filter field
3. (optional) Filter two dimensions simultaneously
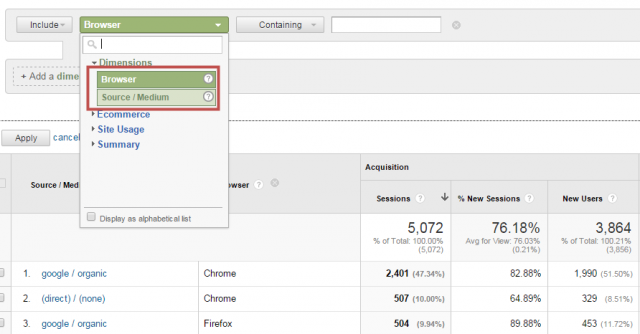
You have the option to filter on two different dimensions at the same time if you add a secondary dimension to your report, as shown below. Here both Browser and Source / Medium are visible in the Google Analytics report and advanced filter field.

Note: the advanced table filter is limited to the dimensions and metrics that are included in your report. Also, by default the advanced table filter is linked to an AND equation. By smartly working with regular expressions you can build an OR equation as well. Google Analytics accepts RegEx in both standard as well as advanced table filters.
Concluding Thoughts
- Make sure to understand the difference between view filters and table filters
- Start every data deep dive with a business question; what are you trying to solve?
- Advanced table filters provide you with a great option to filter out anomalies before exporting or presenting a report
- Start with one or two advanced filters and expand if you need to
- Make sure enough data on the level of dimensions remains to draw statistically significant conclusions.


