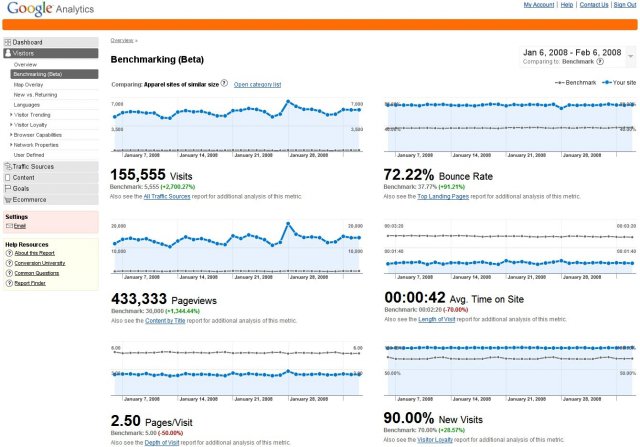
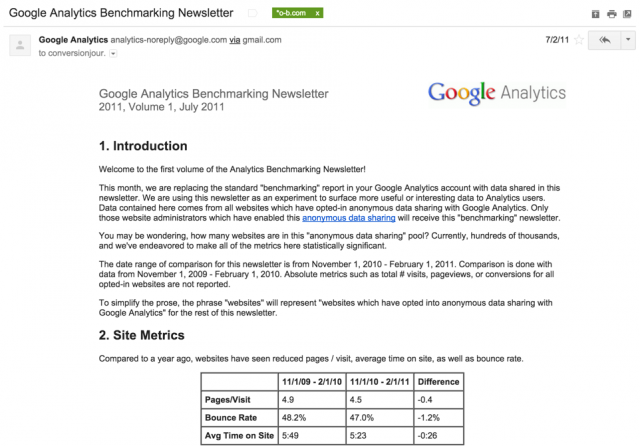
Back in 2008, the Google Analytics team released a feature that was extremely innovative: Benchmarking. Fast forward a few years, the format changed to a monthly email newsletter, which users would get in their inboxes instead of browsing the Google Analytics user interface. This week the newest version of it has been launched, and it looks way better! (see the evolution in the end of the article)
Before we go into the reports and how you can use them, I would like to delve a little bit on why Benchmarking is such an extremely important tool. I believe that the word that best describes the value of Benchmarking is ‘context’. I often talk about context in my presentations, and how you can use features like Annotations, Cost Data Upload and others to add more context to your data. This will enable you to understand as much around a fact as possible, making conclusions more meaningful and accurate. The word ‘context‘ comes from Latin contextus, from con ‘together’ + texere ‘to weave’. And that’s what we are trying to do, isn’t it? To weave together a meaningful story from the data.
Benchmarking is extremely valuable in that it provides the necessary context to show you if your increase (or decrease) is not only a result of your actions, but of a larger trend in the industry. So, for example, if you see an large spike in traffic from the USA, is it something that all your competitors are seeing too or is it a result of your latest campaign? Or if you see an increase on mobile visitors, is it a result of a global trend or a result of your latest mobile-friendly design? Google Analytics Benchmarking will help you answer that.
Enabling Google Analytics Benchmarking
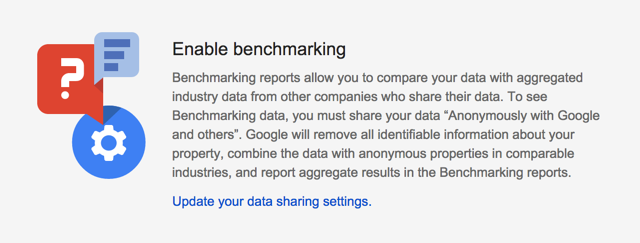
Benchmarking is still not available to 100% of users, it will be rolled out in the coming weeks. But once it is available, you will see a menu named Benchmarking under the Audience section on the left navigation of Google Analytics. If you click on it, you might see the note below, depending on your data sharing settings (if you don’t see it, you are good to go).

Following the link will lead you to your data sharing settings, where you need to check the box with the text shown below to have access to this feature.
Anonymously with Google and others
Enable benchmarking by sharing your website data in an anonymous form. Google will remove all identifiable information about your website, combine the data with other anonymous sites in comparable industries and report aggregate trends in the benchmarking service.
Example Use: Google Analytics Industry Benchmarking
- Use Benchmarking to compare your site’s performance with those of other websites in your industry.
- Pinpoint performance problems and estimate how much you can improve your site metrics.
Benchmarking Reports
The Benchmarking tool is composed of three reports: Channels, Location and Devices. We will go over each of them, but before, let’s understand how the benchmarks are defined and how can you tweak them. Below is a screenshot from the tool showing the navigation options.

- Industry Vertical: this allows you to choose which vertical (and sub-vertical (and sub-sub-vertical)) you would like to compare your website to. Note that the deeper you go on the vertical hierarchy, the smaller will be the sample you are comparing your website against.
- Country / Region: this allows you to choose which country and region you want to benchmark against. As above, if you benchmark against USA the sample will be much larger than benchmarking against California, so there is a tradeoff between accuracy and precision.
- Size by daily sessions: the size of the business in terms of average number of daily sessions.
- Benchmark group size: the number of properties that contribute data to establish this benchmark.
- Benchmark dimension to chart: you can choose among various dimensions to be shown in the chart. Here are the options: % Benchmark New Sessions, % New Sessions, % New Sessions Benchmark Delta, Benchmark New Users, Benchmark Sessions, New Users, New Users Benchmark Delta, Sessions Benchmark Delta, Avg. Benchmark Session Duration, Avg. Session Duration, Avg. Session Duration Benchmark Delta, Benchmark Bounce Rate, Benchmark Pages / Session, Bounce Rate, Bounce Rate Benchmark Delta, Pages / Session, Pages / Session Benchmark Delta.
Apart from those navigation options, you will also see, just above the chart, two new icons that can be use to show/hide the colors on the table (green/red) and the comparison numbers.
Channels Benchmarks

This report will help you understand how you are performing against similar businesses when it comes to acquisition channels. So, for example, it will help you answer questions such as:
- Am I doing well on my Email campaigns?
- Should I invest more in Display Advertising?
- Is my website SEO optimized compared to my competitors?
Location Benchmarks

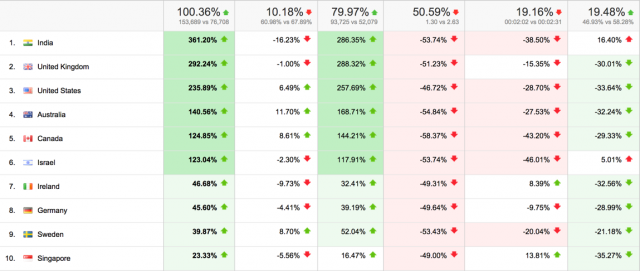
This report will be useful to understand where in the world you are doing well and where you are doing worse. If you operate only in one country it will be simpler to understand, but if you have a global audience it might be interesting to use this together with the other reports. For example, if you see that you are underperforming in Canada, you might go to the Channels report and see in which channel you are doing worse in Canada.
Devices Benchmarks

Did you hear about the mobile planet? Yes, we live there! This is an extremely insightful report that will show you if you are missing customers because your competitors are better adapted to mobile.
Benchmarking Evolution
Just for fun, I thought I would add screenshots of the previous Benchmarking features on Google Analytics…
Benchmarking Reports – 2008 Edition

Benchmarking Newsletter – 2011 Edition
This was the very first edition!

Benchmarking Tool – 2014 Edition


