Google Analytics allows us to easily integrate our Google AdWords campaign data for reporting and analysis. This makes sense, as Google wants us to be able to understand engagement and performance metrics after somebody lands on our website, or downloads our app, from a paid ad. They’re also both Google products too, so integration helps!
But in order to truly understand the performance of our AdWords campaigns we need to be able to evaluate success within the context of all our marketing initiatives. For example, if we are running paid campaigns through AdWords, Facebook, LinkedIn and Twitter we really need a way to understand how the conversion rate from our AdWords campaigns compares to our other advertising. We can then start to get an idea of the kind of Return On Investment (ROI) that different marketing initiatives are generating, and use that information to make smart decisions about future budget allocations.
We have always had the ability to export AdWords data or pull out data from Google Analytics in order to compare campaign performance. You might have been doing this in Excel or Google Drive, and you’d know it can be a bit of a tedious process! It also meant that your analysis was limited to the metrics that you had exported originally.
This is where Google Analytics Cost Data Upload comes in. It allows you to import the extra pieces of data belonging to your non-AdWords paid campaigns. This means you can quickly evaluate the performances of all your campaigns, compare advertising costs and ROI right within the Google Analytics interface.
The reports that are created from your uploaded data won’t provide the same granular detail available within the AdWords reports (think ad groups and individual keywords), but it will enable you to start performing top-level analysis within Google Analytics. Another thing to remember is that the reports also rely on people actually traveling through to your website, so if you have impression data without a click then you won’t get additional insights from the reports.
Steps to upload Cost Data into Google Analytics

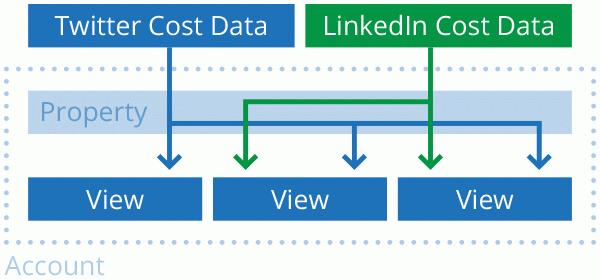
Before we start, it’s important to understand that custom data is uploaded to a property inside Google Analytics and is then applied to one or more views. If you have a large-scale implementation, then it means you will have to repeat the process if you want data available within views that are contained in different properties. For most cases this won’t be needed, but it is good to remember that upload is at the property-level and not the account-level.

Another critical thing to check is that you are using campaign tags on your inbound links to ensure that you can match your cost data to data that is available within your Google Analytics reports. The campaign tags you use will become the key that you use to combine the data together inside your reports.
If you are just getting started, then you will need to learn about Google Analytics campaign tags and begin using them before you can begin uploading cost data.
Step 1: Setup Custom Data Source
The first step is to setup the custom data source. After you have signed in to your Analytics account, navigate to the Admin section and select the appropriate property.
Within the property, select ‘Custom Definitions’, then ‘Custom Data Sources’, and then the ‘New Custom Data Source’ button. Now you will need to name the data source, provide a description and select the view(s) where you want this data to be available.
For example, if you are going to upload cost data from ads on LinkedIn you would create a new data source called ‘linkedin’ and this will then store all of your LinkedIn data. In most cases you will need to set up multiple custom data sources for each of your advertising channels. This means if you advertise on LinkedIn, Facebook and Twitter you would need to create three separate data sources.
You can create up to 25 custom data sources within Google Analytics for uploading campaign cost data.
Each custom data source you create will have a unique ID or key which is used to ensure that data that is uploaded ends up in the right data source. Data can be uploaded daily to the custom data source and this can be viewed by selecting ‘History’ to view all historical data uploads.
Step 2: Download Data
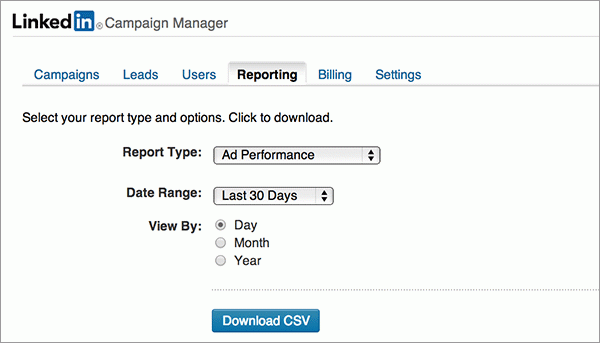
Now you will need to download your cost data for each custom data source you have created. For example if you are going to upload data for your LinkedIn ads you will first need to download this from LinkedIn Campaign Manager. You can find this under the ‘Reporting’ tab.

Ideally you will download a CSV containing the data. If this is not available then you can go with another format, but it might mean a bit more work formatting the data.
Step 3: Configure Data Set & Format Data
Once you have the data we need to head back into Google Analytics and configure the data set so that when we import our cost data, Google Analytics reads the correct data into our reports and also assigns our cost data to the correct ads.
Heading back to the admin section, find the property where we set up the data source in our first step and select ‘Data Import’. From here we click the name of the custom data source we originally created. For our example we will click ‘LinkedIn’.
Then we need to select the columns of data that we have available from the data that we downloaded in step two. At a minimum we need ‘Medium’, ‘Source’ and either ‘Impressions’, ‘Clicks’ or ‘Cost’, but the more columns we can create (based on available data), the more insights we will have when we head to our reports.
If we open the report downloaded for our LinkedIn example, we can see we have columns for ‘Impressions’, ‘Total Clicks’ and ‘Total Spend’ which we can use for ‘Impressions’, ‘Clicks’ and ‘Cost’. Since this data is from LinkedIn we can also assume that ‘Medium’ will be CPC as we are paying for the clicks and ‘Source’ is linkedin.com because that is where our ads have been displayed. For LinkedIn we can also establish ‘Ad Content’ for each individual ad variation and ‘Destination URL’ which is the landing page we were sending traffic to from the ads.
It’s important to know that if you select ‘Medium’, ‘Source’, ‘Campaign’, ‘Ad Content’ or ‘Keyword’ for columns in your data set, each of these needs to directly correspond to UTM campaign tags that are already available within your reports (before you upload data).
For example, if you didn’t set any UTM campaign tags for your LinkedIn campaigns, then even if you define values for these parameters within your CSV for upload, the data won’t correspond to anything within your reports.
When you are happy with the columns, click the ‘Get Schema’ button. This will show you the first line that is needed within your CSV file. You can also click the ‘Download Schema Template’ button to get this in Excel format.
Once we have the header for our CSV file we need to get all of the data into that format. For example, if your schema header looks like:
ga:medium,ga:source,ga:adClicks,ga:adCost,ga:impressions
Then this means the first column will contain the medium, the second the source and so on. If you are working in a spreadsheet (before exporting to CSV format), then you will have something along the following lines:

Then you will need to get the data you have downloaded into the correct format. For example:

If you have been working in Excel or Google Drive, you will then need to export this as a CSV ready for upload. This will give you a file that contains something like:
ga:medium,ga:source,ga:adClicks,ga:adCost,ga:impressions

cpc,linkedin.com,135,302.4,10732

cpc,twitter.com,93,90.21,3090
We are now ready to upload the data into Google Analytics.
Step 4: Upload Data
To get our data into Google Analytics we need to use the Management API to upload the data. Currently, there is no option to upload data directly within the Google Analytics interface, hopefully this will become available in the future for people just looking to upload small amounts on an ad-hoc basis, but for now we need to use the API.
If you are in a marketing or non-technical role, then you probably don’t want to go through the process of creating your own method for uploading data using the API. There are existing tools that allow you to upload data without having to get into any code.
For those starting out, our friends at LunaMetrics have created a cost data upload tool that uses a simple interface to allow you to upload your file using the API after you have logged into your Google Analytics account and authorised the tool.
There are also a number of paid tools that allow you to upload cost data, including:
- Supermetrics Uploader which is a web-based solution and offers a pay-per-use option starting at $99 for 100 uploads.
- For Excel folks there is Next Analytics which starts at $39 for 30 days and ShufflePoint which starts at $49 per month.
- Analytics Canvas is a software solution and starts at $49 per month.
Analyzing Marketing Campaigns
From here we can begin analysing our campaign performance within Google Analytics. The ‘Cost Analysis’ report is available within the Acquisition section. The report will automatically calculate CTR (Click Through Rate) and average CPC (Cost Per Click) from your click and impression data.
It’s important to ensure you have goals configured (and ecommerce if you are selling online) as this will give you the data that you need in order to analyze performance, including RPC (Return Per Click), ROI (Return On Investment) and Margin. When using these metrics remember that they are calculated against your advertising cost, so they will not include any costs or investment other than the actual amount you have paid for the clicks. You might want to consider exporting this data into Google Drive and perform your own calculations, so you can factor in elements like human resource (the amount of time to create and manage your campaigns), profit margin (if you are focused on ecommerce transactions) and even CLV (Customer Lifetime Value).
Whatever you decide, you want to identify campaigns that have a higher likelihood to convert, along with higher value (where you look at ROI and CLV). Once you identify your top performing campaigns you can begin to perform more in depth analysis and start incrementally testing campaign changes to see if you can improve performance.


