This article was contributed by Bill Tripple, Senior Consultant of Digital Intelligence and Alex Clemmons, Manager of Analysis & Insights, Digital Intelligence, both from the award winning digital data analytics firm, Cardinal Path.
One of the most basic questions asked by marketers is: “How much content is being consumed on my website?” Traditionally, content consumption has been measured through the use of pages per session (total pageviews / total sessions). This metric has served as a simple barometer for content consumption for many years, but it has its limitations: namely that we can’t drill down to easily see which page(s) on the website are actually driving additional content consumption vs. which pages are just the most popular.
Enter Page Velocity, a custom built metric within Google Analytics that allows us to drill deeper and understand which pages have the greatest influence in driving users deeper into a website. Through the use of page velocity we have the ability to see that Page A drives, on average, five additional page views, whereas Page B only drives three. Perhaps we optimize some of our landing pages to take elements of Page A and test them on Page B. Or divert media traffic from one page to another.
As you can imagine, this metric can be very useful for content-driven websites that depend on advertising dollars, as we can now look into which pages are driving the highest ROI (propelling users deeper into the website)
Defining Page Velocity
The basic principle of page velocity is as follows: Page Velocity = (number of pages seen after the current page is viewed / unique page views to the current page)
The following example measures page velocity from three sessions:
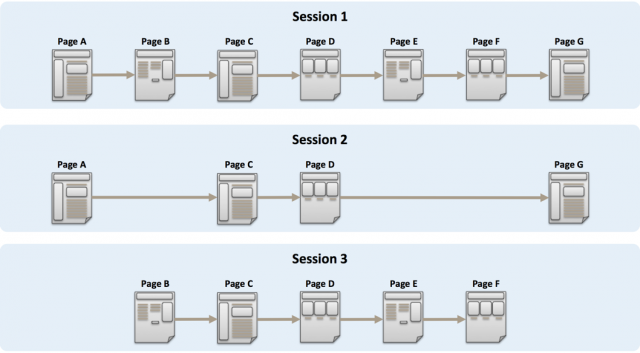
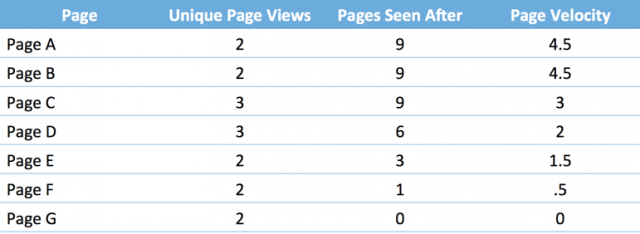
From here you can start to see how this comes together. Page A is tied with page B for the highest Page Velocity. Both were seen within two sessions and both drove a total of 9 additional page views. Page G is on the low end with a velocity of 0. It was seen within two sessions but did not drive any additional page views.
Of course you can also start to imagine where this metric has its flaws in that some pages will have a low Page Velocity by design (like the thank you page of a form, for example). Understanding the purpose of each page will be critical for successful analysis using this metric.
Using Page Value to Measure Page Velocity
The measurement of Page Velocity takes advantage of the Page Value metric within Google Analytics. Before diving into specifics, it’s important to understand how Google Analytics evaluates Page Value. In Google’s official documentation they provide an example where page B would receive a page value of $110 ((10+100) /1 session):

To measure Page Velocity, we will need to send an Ecommerce transaction with an arbitrary value of $1 on every pageview so it receives credit for the future pageviews as well.
If you are already using Ecommerce, this will inflate your real Ecommerce metrics / reports, so we recommend that you create one view specific for page velocity, and filter out these Ecommerce transactions in your remaining views. Additionally, you’ll want to filter legitimate Ecommerce transactions from your Page Velocity view.
Using this trick, we can now answer the question of which pages on your website are actually driving visitors the deepest. The next step is to segment your visitors, to further optimize existing and future content. Below you will find a pages report showing our Page Velocity metric via the Page Value column.
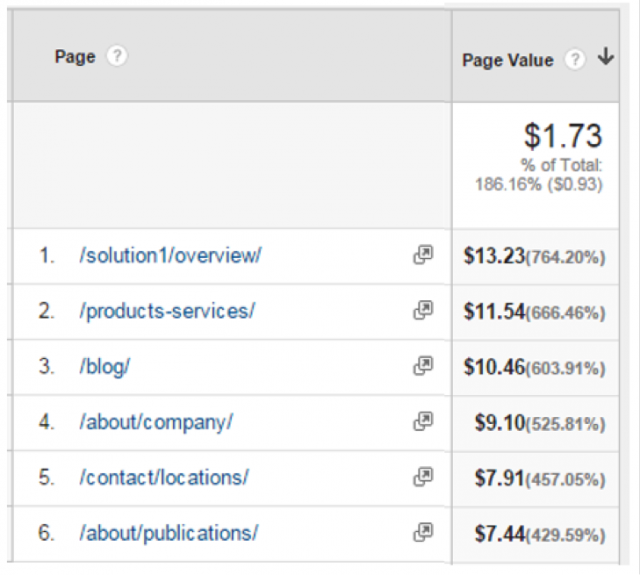
Even though we’re seeing a dollar value, this really represents the velocity. So the page in row 10 of the above screenshot drives an average of 5.27 additional pages.
Going a level deeper with segmentation
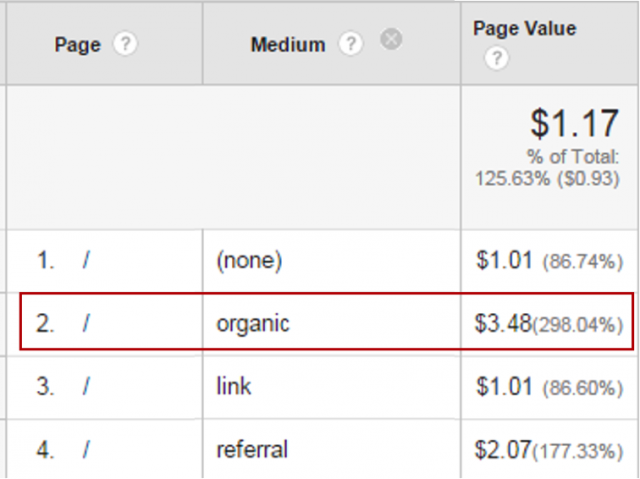
The next step is to segment your visitors, looking at page velocity by different source/mediums, by custom dimensions, etc. You can find two useful examples below.
1. Pages segmented by “Medium” with a secondary dimension
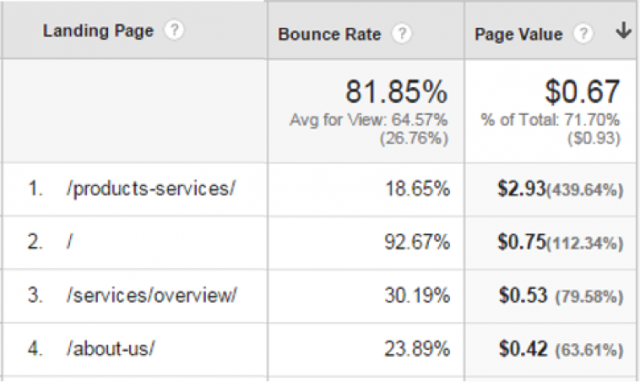
2. Pages segmented by “Landing Pages” with a secondary dimension
Landing Page Velocity along side bounce rate can be very telling. For example, a page with a low bounce rate but also a low Page Velocity may be one to look deeper into.
Additional use cases
At first glance, Page Velocity may seem to be useful only for content-heavy sites. But this is not the case. We have found that marketers across verticals have an appetite for this metric including in Ecommerce, Banking, Finance, Higher Education, Non-Profit and many others using it in various capacities. One major benefit of the metric is that it is completely customizable to the needs of the website and stakeholders utilizing it.
For example, on an Ecommerce site you may want to understand which products are driving additional research. Tailoring Page Velocity to only be captured on research focused pages (say a product detail page and a product gallery page) would allow us to tailor this metric to be something like Product Research Velocity.
About the Authors
 Bill Tripple is a Senior Consultant of Digital Intelligence at Cardinal Path, his area of expertise includes analytics implementations for both Google and Adobe products, and he is convinced that he can track nearly anything. He is certified in Google Analytics, Adobe Analytics, and Eloqua. His current and past experiences in the Digital Marketing and the development industry has given him a competitive edge to easily associate and relate with both Marketers and Developers. Learn more about his professional experience on LinkedIn.
 Alex Clemmons is a Manager of Analysis & Insights, Digital Intelligence. He leads day-to-day operations across multiple clients at the award winning digital data analytics firm, Cardinal Path. He has a passion for finding meaning in mountains data and will jump at any opportunity to help clients apply their data to drive results. His area of expertise include measurement strategy, testing and deep dive analysis focused on identifying areas for optimization. Learn more about his professional experience on Linkedin


