The mobile app was the first non-web platform to be built into the Google Analytics suite as a first class citizen; it was really a response to the shift towards smartphones and tablets we have seen in the last six years or so.
While in the past we had to hack together our own solutions to track mobile apps (and they would still end up looking like websites in reports), the new Google Analytics’ Mobile App Analytics easily allow us to track user interaction within our apps, with app-centric data surfaced in reports. Gone is the web-centric approach: mobile app developers will get thrilled to find that reports now reflect data that make sense to them as a business.
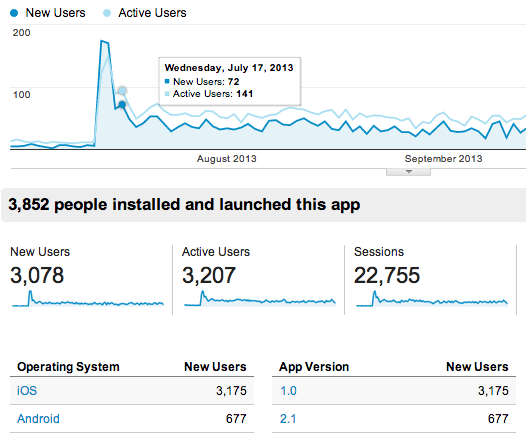
Data is great, but the purpose of Analytics is to get insights so that we can take action. In this post, I will cover some sample reports from the new app tracking interface and how they can help us make decisions for our business.
Launch: How Many People Are Using Our App?
So let’s assume we have just released a new version of a ‘Flight Search’ app. We received that email notifying us that it has been approved on a marketplace (finally), and we’re up and running. Or, perhaps, we have just launched some new marketing campaign targeted to specific regions to get people to install our app. It will be valuable for us to be able to monitor, in real time, our success in acquiring users, where they are coming from, and how they engage with our content.
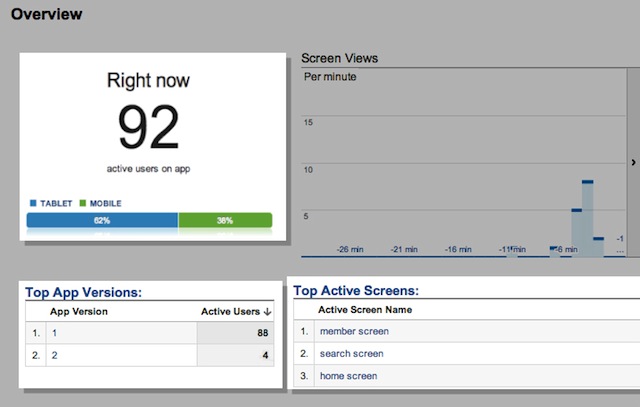
This is where the Real Time report comes in handy. Within seconds of user interaction, data gets surfaced in the report, allowing us to take action quickly on the information available. We will be able to see the number of users by app version, the screens they are active on, as well as their geographical location (down to a city-level)
Measure & Iterate: How Do We Optimize User Experience?
Ok, we are acquiring users and we are engaging with them in a variety of ways. It will now be essential for us to understand how users interact with and move through the app. We want to be able to answer questions such as:
- Do we have any bottlenecks?
- Where are users leaving the app?
- How do users behave differently depending on operating system, language, etc.?
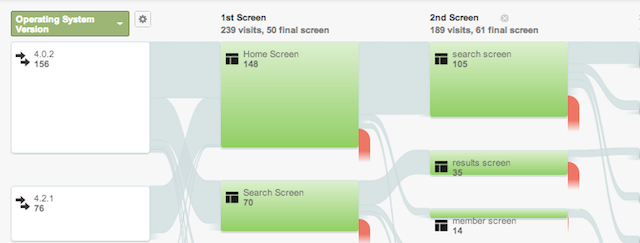
The Behavior Flow report will show us how users flow through the app: where they drop off, how they reach specific screens, in what order. For example, in the report for our ‘Flight Search’ app below, it seems we have some significant drop-off rates (the red) on some of our main screens.
We might want to slice and dice this data a bit to see if we can narrow down the problem to particular operating systems, app versions, user types, etc. This sort of analysis empowers us to reiterate and improve user experience.
Measure & Iterate: How Do We Prioritize Issues?
Our app is live on the app marketplace, but user reviews indicate that it has some technical issues, it seems to be crashing occasionally. To be realistic, bugs are an uncomfortable fact of life for developers, and we are probably always going to experience them to some extent. The question we seek to answer, then, is how do we prioritize? Where should we allocate our resources?
The Crashes and Exceptions report will give us some key data which will bring us closer to answering these questions. It will highlight information such as:
- What is the exception?
- What is the impact of the exception?
- Where/when is it occurring within our app?
- On what devices, operating systems, app versions?
Looking at the report below, it appears we fixed one bug when upgrading to 2.1, but introduced another. It will be important to segment this data to try to retrieve more information about the exceptions so that we can take appropriate action. For example, perhaps the bug only exists on Android, but not iOS. Consequently, our Android team has some work ahead of them. Our iOS team gets to go to the pub early.

We distinguish between crashes and exceptions in reports. Exceptions are the superset of crashes, because not all exceptions are fatal. In our report above, however, we only have fatal exceptions.
Evolve: What OS/Features Should We Focus On?
As we look to develop our app further, new challenges arise, and we need to know how to allocate resources within our company. What operating systems should we focus on? What app features? In other words, where do we get the most bang for our buck?
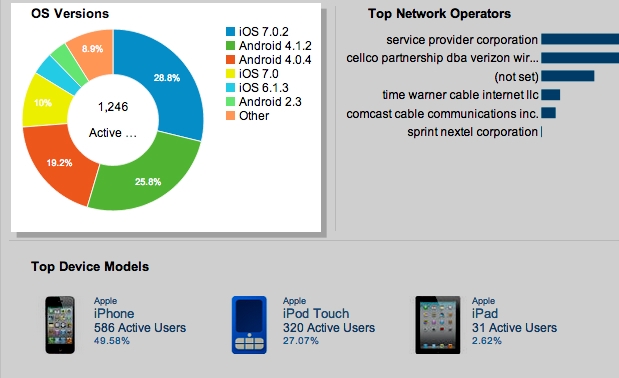
Looking at the Devices and Network Overview, we are again able to extract some key information for our ‘Flight Search’ app. For example, most of our Android users are on 4.0 or higher. In fact, only a small percentage of our user base is on Android 2.3 or lower. This tells us that if we were to drop support for Android OS versions below 4.0, that would affect relatively few users.
On the up side, we could instead start using those 4.0+ features, and we wouldn’t have to keep supporting 2.3, which could save us some headache. On the other hand, maybe we have so few users on Android versions below 4.0 because our app is not optimized for those users, which is something we might want to look into. It is important to approach this type of data from several angles to make the best decision for our business.
Evolve: What Users Should We Focus On?
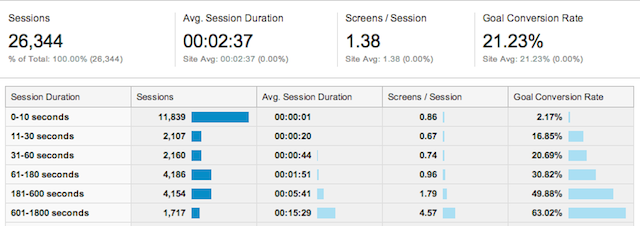
As our user base grows along with a richer dataset in Google Analytics, we will also be empowered to identify and take action on key segments. Behavior reports such as Session Duration and Loyalty below offer some really valuable insights.
It appears our conversion rate goes up with a longer session duration and more session instances. This tells us that we should focus on retention and engagement: we want our users to keep coming back to our app, and we need to address any early fall off points (which the Behavior Flow report above can help us with). The data indicates that repeat-users and users who engage with our app for longer periods of time have a higher chance of converting. This is essential information that cascades into both our marketing and design efforts.

Reporting: How Do We Best Present Data?
So far we have discussed out-of-the box reporting, all populated by default by the Google Analytics SDK. However, it can be extremely useful to surface business-specific dimensions and metrics. That is, data that reflect our particular business. I have previously written about some custom dimensions use cases and how they can be leveraged to enhance reporting.
Custom dimensions are just like the default dimensions available in Google Analytics, except we can create them ourselves, giving us the option to collect additional data that is not provided automatically.
Not only do custom dimensions allow us to capture additional information about our users and content, they also enable us to create reports that will make sense internally within our company. People in our organization may be unfamiliar with the terminology and presentation of data in Google Analytics.
By creating a custom dimension representing ‘Customer Tier’, for example, we are able to produce segments and reports like the one below, highly relevant to our business analysis and shareable throughout our company.

Similarly, custom metrics enable us to to send custom data to Google Analytics, but custom metrics take integer values instead of strings. For our ‘Flight Search’ app, we might want to increment custom metrics upon searches, reservations, and cancellations, etc. to be able to produce a custom report like the one below. Again, this is relevant for our particular business and will make sense internally, even for users unfamiliar with Google Analytics.

Closing Thoughts
The Google Analytics Mobile Apps SDKs make the implementation of Google Analytics in our mobile apps easier than ever and opens up some really powerful analysis. By measuring and iterating on app usage we can continuously work towards a better user experience, which will ultimately benefit our businesses. Sometimes it can be as easy as identifying an obvious bottleneck to monetization, sometimes more careful analysis will be required to reach those valuable insights.
My aim with this post has been to give you an idea of how to get started with mobile app tracking analysis. I would love to hear how you are using, or plan to use, these reports yourselves!


