Enhanced Ecommerce brings with it a new bag of toys for analysts and marketers. In this series of posts, I’ll cover what I believe to be some of the most beneficial features, how they are best leveraged, and some handy tips to make sure the implementation goes smoothly.
First up: surfacing complete visitor journeys using product impressions and detailed views.
Note that Enhance Ecommerce is a Universal Analytics-only feature. If you have not yet updated to the new tracking library (analytics.js), this will be a necessary first step before proceeding with implementing these new ecommerce methods.
Frankly, tracking only cart checkout steps and purchases tells us fairly little about the performance of products on a website. Yes, it will tell us crucial things such as where people drop off, which products make it all the way from cart addition to purchase, etc., but it leaves us blind to some of the most essential first steps our visitors take through the jungle that is our website.
By keeping track of complete user journeys in relation to our products we can start answering precisely the following questions.
- What gave our visitors the idea to buy a product in the first place?
- Why did they pick one product over the other?
- Where are the “hot spots” in which to place the products we want to push?
- Which product copy sucks?
Product Impressions

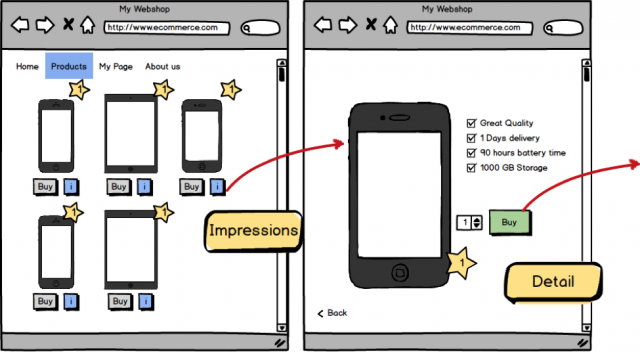
The impression methodology allows us to surface data about where visitors saw a given product, where it was positioned in a list of several products, what context it was presented in, and so on.
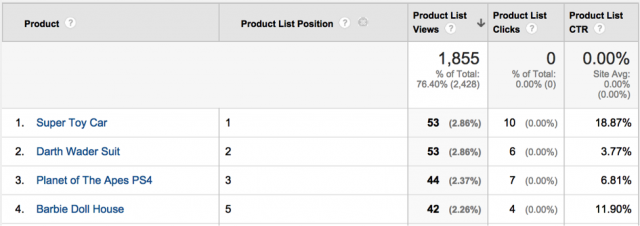
CTR, click-through-rate, is not a metric reserved for ads. This sort of measurement is equally important on our website. Enhanced Ecommerce allows us to surface CTR for categories, brands, products, and internal promotions, giving us a critical data point needed to evaluate performance and optimize against it. To start tracking CTR, compliment your impressions methods with the click methods. The ratio between clicks and impressions will give us the CTR.

By attaching impression data for each visible product to a hit, such as a Pageview or an Event hit, we can pass the following attributes to Google Analytics:
- Name (required): The name of the product, which will show up under the “Product” dimension in GA.
- Id (required): Our identifier for the product, which will show up under the “Product SKU” dimension in GA.
- Price: Yep, it’s what it costs.
- Brand: The brand name, such as “Apple” or “Samsung”.
- Category: The product genre, such as “Apples” (if we’re selling fruit online).
- Variant: The variation of a products, such as “Green” or “Red”. Or “Kind of big” if the product is iPhone 6 Plus.
- List: This one is important and really brings something new to the table. Use the value of this attribute to surface in what context the product was presented on a page. For example “best sellers”, or some internal identifying number for a list of items. If we want to be really fancy, we could append what sorting method is used as the items are presented, such as “bestsellers: a-z” or “bestsellers: relevancy”.
- Position: This is the good stuff. We can use whatever logic we want (I usually go left to right) to surface what position the product was in on a list of products. The important thing is that we understand where “1”, “2”, etc. means in relation to our website.
One benefit of attaching additional data to hits is that we can include everything in one http request to the GA servers. This is particularly important if we have high volumes of traffic and are subject to the lower hit-limitations of a Standard GA account. Note, however, that a single hit may not be larger than 8192 bytes, which is usually fine unless we are getting above 40 products or have very long descriptive values for the attributes presented above.
Boom, we can start the process of optimizing our website:
- Which product is performing best where?
- Are we placing our most profitable products in optimal positions?
- Are there blind spots where important products get overseen?
- Are some products cannibalizing others?
Tip: If sending this kind of ecommerce data through a separate hit in parallel with ordinary pageview hits, we probably want to mark the hit non-interactive. This means that it is not considered when calculating Bounce Rate (which would skew the metric towards 0). To do this, simply set the value of the “non-interactive” attribute to “true” in GTM or in the analytics.js snippet.
The Holy Rate: Buy-to-Detail
Ok, so we got the impressions down. How are we doing with presenting individual products? The detail method will give us our next clue in understanding how visitors perceive our products.
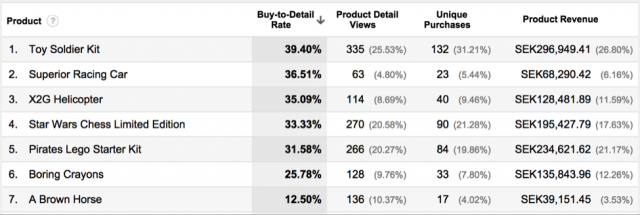
By tracking which items were looked at more closely, we can start connecting the dots between browsing and purchasing. From brands or categories to specific products, this gives us a very important relative metric: the Buy-to-Detail rate. It is what it sounds like: the number of purchases of X divided by the numbers of detailed views of X. So, a relatively high Buy-to-Detail rate tells us that visitors are more likely to buy the product after looking at its details than is the case for products with a low Buy-to-Detail rate.
The attributes we attach to this type of tracking are the same as the ones attached to product impressions above, except “Quantity”, which is usually included instead of “List” and “Position” (which are less applicable here).
- Name
- Id
- Price
- Brand
- Category
- Variant
- Quantity

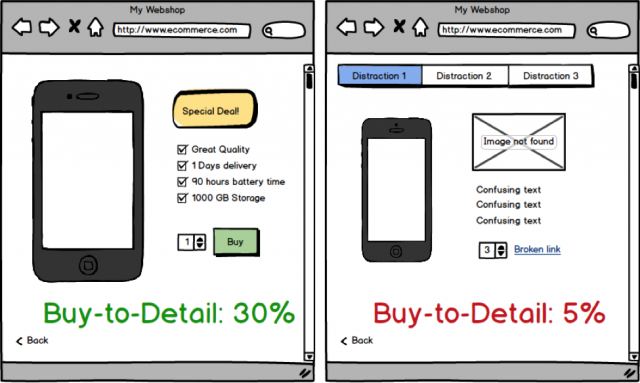
When comparing the winners to the losers, we will start identifying our mistakes as well as our bull’s-eyes:
- What makes up a killer copy?
- Which Unique Selling Points are most persuasive?
- What might defer a visitor from buying a product?
- What Call-to-Actions are most successful?
- What other patterns in visitor behavior can we detect?
Based on these insights, we can start optimizing how we present our products, either through A/B-testing or by direct changes if we’re confident or if we lost the login credentials to Optimizely again.

But wait, can’t we just count the number of pageviews for each product page and put that in relation to purchases? Of course we can, but what’s the fun in that, party pooper. Also, such a methodology is also dependent on a clear URL structure including all the attributes aforementioned that can easily be tied to the sale of each product. It will result in some serious hair tearing trying to match rows in Excel if we’re dealing with a large number of products (trust me).
In contrast, the Enhanced Ecommerce methodology will enable us to set up reports that are comprehensible and easy to manage in the long run. Since these new dimensions and metrics will now be available to us throughout the GA interface, we will be able to set up tailor-made custom reports showing us exactly what we need in terms of product performance.
Conclusion
The new Enhanced Ecommerce methods for product impressions and detailed views are extremely useful and will bring new data points to the table which are hard to hack together ourselves. In fact, it will surface data that we might not even be able to get anywhere else, as it ties back to all the segmentation power of Google Analytics (technology, behavior, attribution, etc.). Perhaps most important of all, it will give us actionable insights that we can work with to continuously improve the presentation of products and the performance of our ecommerce business.


