The content you provide to your visitors can make or break your brand. At the end, the information that you provide to your visitors plays a huge role in whether they buy your products and services or not. That’s why it is crucial for you to understand how your content performs and which steps you need to take to improve your content marketing results.
Google Analytics tracks several metrics by default: time on page, exit %, bounce rate, etc. With these metrics you just scratch the surface of what insights you can get through your content reports.
Configuring Google Analytics in the right way will help you answer the following questions:
- Which content resonates best with your readers?
- What landing pages drive the most conversions?
- Which secondary actions on a specific page help you sell more services?
- How to improve your future content marketing efforts?
In this article you will learn how to set up Google Analytics to make your content reports super actionable.
Step 1: Measure All Your Pages
This might sound like a no-brainer to you, but it’s a crucial first step. Even in a very simple implementation, all pages get tagged almost automatically.
Three examples where things can go wrong:
- “A page is not important and doesn’t need to be tracked.” I strongly recommend to tag every page on your website, even if you come up with a very good reason not to track some of your pages. Instead of not tagging a page, you can exclude the page via a filter on your Views.
- The website involved contains a few subdomains that are not tagged correctly. This often happens with Ecommerce carts or “mini-sites” that companies create for special promotions.
- External applications, e.g. Leadpages, are used. Very often you need to manually insert the tracking code on these pages to make sure everything get’s tracked.
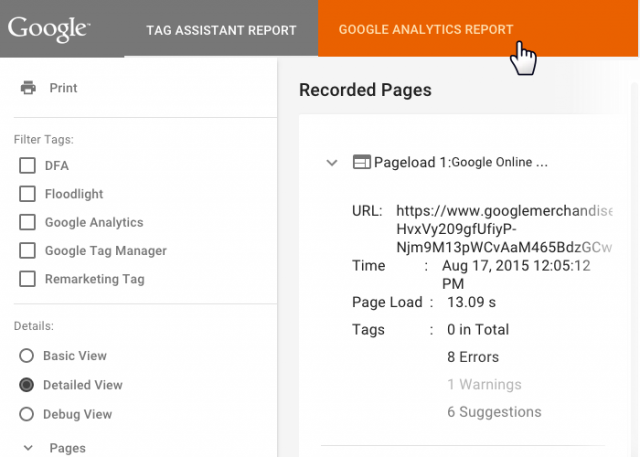
To help on that, Google create Tag Assistant, a Chrome extension that can be used to create validate, diagnose, and troubleshoot your Analytics data on each of your pages. Once you create a recording a detect a problem, you can correct the setup and check again whether your tags are firing properly. Here is a quote on how it can help you, learn more about it in the Help Center.
Recording a flow helps you validate that Analytics tracking on your site works as expected. Choose a critical set of steps to record. These steps typically include pages on your site. You can also include pages from other sites from which a user may initiate a visit to your site, such as google.com, or a third-party site with an ad linking to your site. For example, if you run an ecommerce site, run through the pages and steps required to select an item, place the order, and submit payment. If your site’s purpose is lead generation, walk through the process of navigating to and signing up for your promotional newsletter.
Step 2: Exclude Your Own IP Address
Excluding sessions from your own company or any known third party is a must if you want to collect meaningful data. The larger this group relatively is, the bigger the impact on your numbers.
I have dealt with large companies where everyone sets the company homepage as the starting page in their browser. This can heavily impact key metrics like conversion rate, bounce rate and several more metrics.
Here is the filter you need to set up:
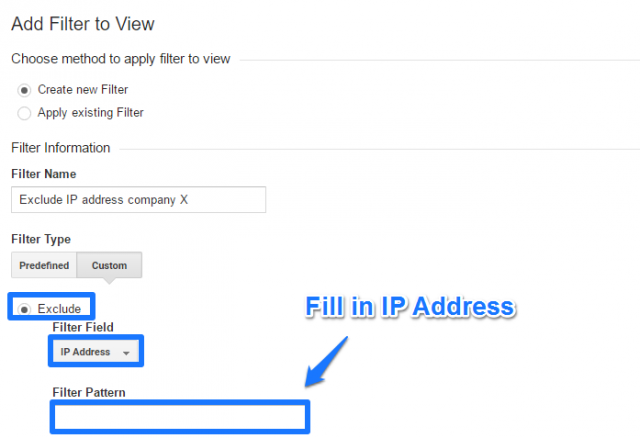
Learn more about exclusion options, it may be useful if you need to set up a filter for a range of IP addresses.
Step 3: Exclude Your Technical Query Parameters
I have come across thousands of duplicate pages in a lot of Google Analytics accounts. This is often because of a large amount of technical query parameters on the website involved.
Here is an example where you would want to see only one page, but Google Analytics would register three different pages when using a default implementation:
www.test.com/duplicate-page/www.test.com/duplicate-page/?id=12356www.test.com/duplicate-page/?id=15687
Two Ways to Fix it
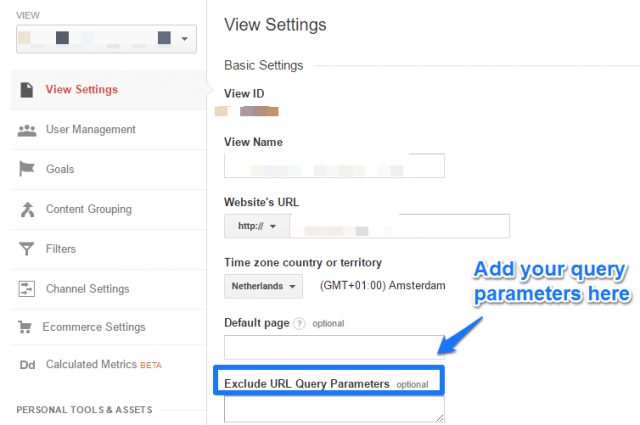
Option 1: remove your query parameters in the view settings. Add them to the field shown below and separate each of them with a comma.
Option 2: remove all your query parameters with a filter. Please be careful when choosing this option. You will remove all your query parameters if you apply the filter below.
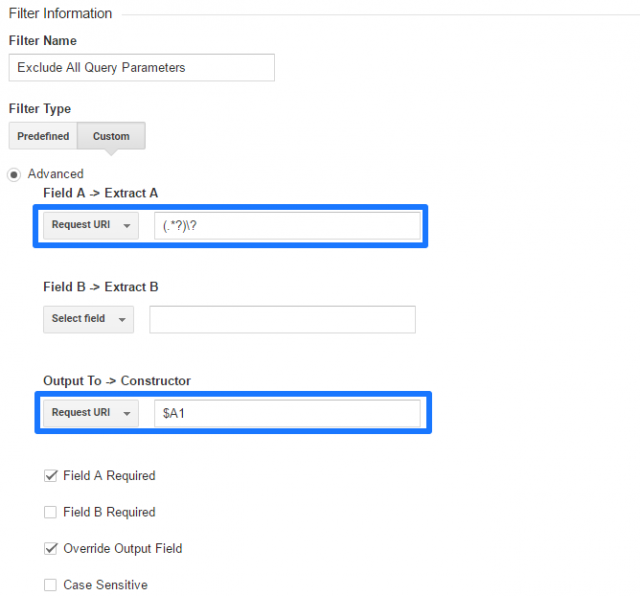
Please note that filters don’t work retroactively.
If you need a reminder on how filters work, read this comprehensive filters guide.
Step 4: Add Interactive Events for On-Page Actions
Google Analytics solely tracks pageviews by default. In a world full of on-page videos, buttons etc., you need to think about Event Tracking, which is the best way to measure on-page interactions in addition to measuring basic pageviews. And they can greatly influence your content metrics.
Here is an example, where the main call to action is a play button that would not be tracked by default on Google Analytics. In this case you would want to add an event to that button.
![]()
You need to create a measurement plan where you list all your website interactions. Determine for each of those whether you want to measure it as an interactive event (impacting bounce rate) or non-interactive event (not impacting bounce rate). This will make the metrics in your content reports reflect what’s going on on your website more accurately.
Step 5: Set up Goals and Goal Values
Two of my favourite reports in the content section of Google Analytics are the All Pages and Landing Pages report. There are two metrics that don’t provide insights from the start: Page Value (located in all pages report) and Goal Value (located in landing pages report).
You need to set up a few things first.
- Step 1: Set up a goal for each of your macro and micro conversions.
- Step 2: Fill in a goal value for each of your goals.
Here is how the reports will look like once you have set this up correctly.
All Pages report
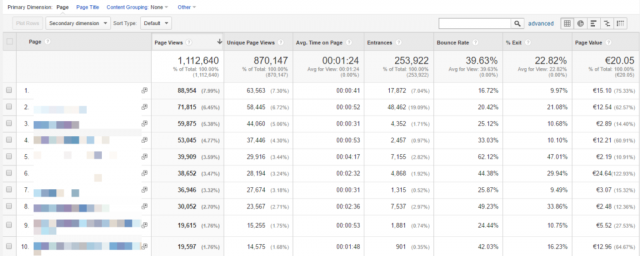
The last column represents the value of each of your pages in relation to your conversion goals. In this case page number six has the highest page value (Ä 24,64). This report will provide you with great insights on which pages are visited before a visitor converts. Funnel steps naturally get a lot of credits so make sure to pay a lot of attention to pages outside of your funnel too.
It’s important to understand how page value is calculated. And make sure not to add a goal value to your ecommerce thank you page if you have implemented ecommerce tracking on your website, otherwise you will measure things twice.
Landing Pages report
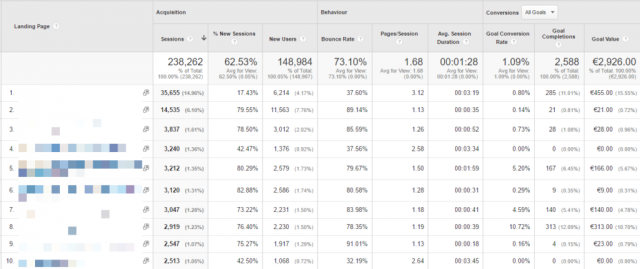
The last column represent the value of each of your landing pages in relation to your conversion goals. In this example, landing page four generates a decent amount of traffic but no direct value. You can create an overview of the total goal value of all your goals like I did in the example above.
If desired you can switch “All Goals” in the top right corner to one specific goal and determine the specific value of this goal in relation to your landing pages.
Step 6: Aggregate Your Most Important Metrics in a Custom Report
Do you find yourself switching a lot between different content reports? Or changing the settings all the time? Before losing yourself in the fancy world of automation and APIs, I recommend to play around with the custom reports module in Google Analytics. It is a really effective way to get a better feeling of which metrics matter most and are very actionable. And how you would like them to be displayed and aggregated.
Make sure that you implement step 1 to 5 first before moving on to creating custom reports for your organization.
A quick example on how to do it:
- On top of your screen click on Customizations.
- Click on New Custom Report.
- Create your custom report.
As an example I have built a custom report for a content publisher who focuses on growing her subscriber list:
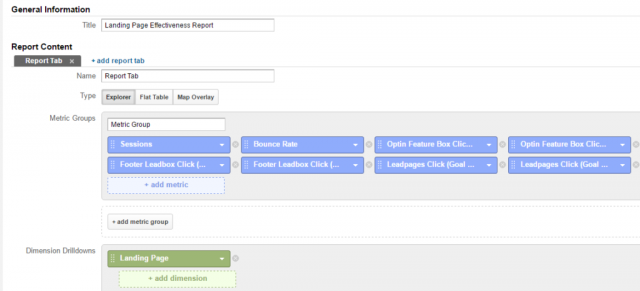
And the actual report looks like this:
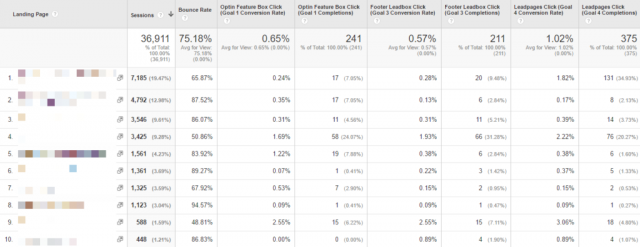
Now she can immediately see how each of her landing pages (mainly blog posts) perform in relation to different conversion goals. And these metrics are really important to her to map out her future content strategy.
Normally I would include a goal value metric as well, but she still needs to define the value of each of her conversions. That would make the report even more powerful.
In short, custom reports give you all the flexibility you need to present your content related metrics in the most actionable way.
Bonus
If you want to learn more about analyzing your content in aggregated clusters I recommend to check out my brand new guide to Google Analytics Content Groupings.
This is it from my side. I hope you have learned a lot of new things to better analyze and optimize your content performance. We very much appreciate a share if you enjoyed reading this post!


