A little over a year ago Daniel invited me to contribute to the Adwords chapter of his eBook on Google Analytics Integrations. I prepared a lot of content at that time, not all of which made the final edit 🙂
The following blog post is one area that can be considered addendum to that chapter; if you are interested on Adwords and GA, you can find a copy of the PPC chapter here. (*Disclaimer: I do not receive compensation for sales of the eBook, though Daniel did take me out for a cup of coffee).
For now, I am going to jump right in and share some of my processes and approaches to optimizing paid search campaigns using Google Analytics.
Bid Optimization Based On Ad Position
The location of an ad in the Search Engine Results Page (SERP) greatly impacts its CTR. The following is not a formal CTR study, but I do have access to a small pool of Adwords accounts which I believe provides a good statistical sample.
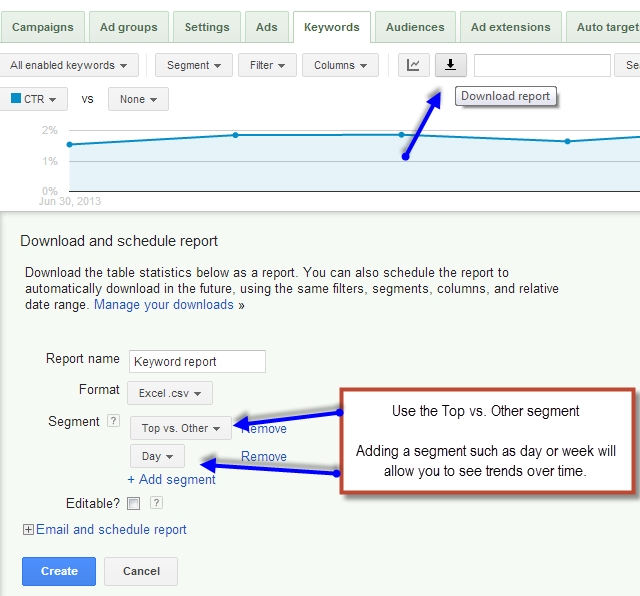
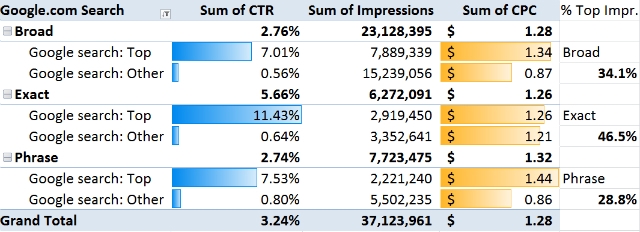
I ran a quick report (screenshot below) measuring CTRs for over 37 million impressions across 33 different Adwords accounts spanning multiple industries (excluding branded keywords). The report itself is a “keywords report” run in Adwords where I make sure to add the “Top vs. Other” segment as well as some sort of segmentation by time. The resulting report will be quite large in many cases, so you want to put it into a pivot table and then graph the results.

For searches on google.com, CTRs were more than 20 times higher, on average, for ads that showed above the organic results compared to ads that showed to the right of or below organic results. Again, while this is not a scientific study per se, the sample size is large enough to support my main point: there is a huge difference in CTR when ads are above the organic results as opposed to ads shown elsewhere on the SERP.

The calculated metric you see on the right of the screenshot above, % of Top Impressions, is what interests me the most. Since CTR is correlated with ad position (especially for Top vs. Right Hand Side), I want to look for changes in position that would be impacting my overall share of traffic. This can be done on the Campaign, Ad Group, or Keyword level by using a pivot chart to graph the percentage of impressions above the SERPs compared to the right hand side (RHS).
Recently, Google has released keyword level impression share data. This is a big development as advertisers can now see their true Percent Share of Paid Search down to the keyword level, and relate their share of search to their click through rates in order to understand fully how much traffic they are driving relative to the available traffic.
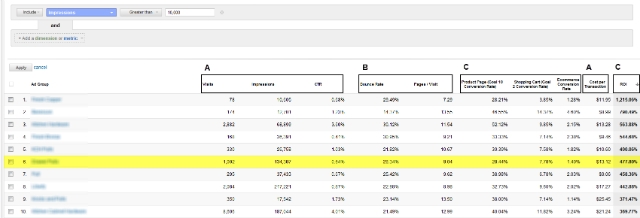
Of course, driving the highest share of traffic possible to one’s site is not the goal of paid search (at least for most advertisers). With that in mind, I created the following custom report to determine which keywords would be the most appropriate to bid more aggressively on the “winners” (click on the image for a larger version).
The GA report above is for a business to consumer ecommerce store. First, I sorted the Ad Groups in a particular campaign by ROI (descending) and then added an advanced filter to only include Ad Groups that had more than 10,000 impressions in the given date range (to weed out Ad Groups with high calculated ROI but low volume). For this analysis, my goal is to find keywords that perform strongly (as measured by ROI), but don’t garner as many clicks as they could due to low bidding. The Ad Group highlighted in row 6 has a fairly low CTR, gets a decent number of impressions, and good conversion metrics (click on the image for a larger version).
When drilling down into the Ad Group, we find that almost all of the impressions are on the Right Hand Side (RHS). The CTRs for these keywords are 16Xs higher when ads display above the Organic results. Since this Ad Group is profitable, we have room to increase the bid to drive more traffic and thereby more gross revenue. It is worth noting that maximizing gross revenue and maximizing profits are far from the same thing.
For a great tutorial on how to adjust keyword bids in Adwords to maximize profitability, see this video.
Closing Thoughts
In short, when increasing your bids, as long your incremental cost per click is greater than your return per click, net profit will continue to rise. (You will need to keep you profit margins in mind too, of course).
I also want to point out that by having your Adwords account integrated with Google Analytics you will be able to automatically see “Ad Slot” as a dimension in your reports. This is very important, because while the initial analysis of percent of search share provided insights into how ads may be performing in a competitive landscape, Google Analytics will provide full visibility into how ads in different slots perform on your site. This is key as it will directly impact your bidding practices.
In the report above I set Product Page Views, Add to Shopping Cart actions, and E-commerce Transactions as goals that I use of the report. As a result, there is a “horizontal funnel” where I can see the total flow of the user through the shopping cart / checkout process AND segment that by where on the Google SERPs they clicked my ad.
In general, I find the Ad Slot dimension in Google Analytics to be much more useful than the Average Position metric reported in Adwords. I am interested in hearing your experiences with this sort of analysis. If you haven’t tried this before, please give it a go and share your insights in the comments below.


