Google Analytics Dashboards: A Step-By-Step Guide
Dashboards are used across the world by most people (and organizations), either in the form of a car dashboard or …
Google Analytics Dashboards: A Step-By-Step Guide Read More »
Data Visualization is the cherry on top of the data world, it makes information useful and meaningful. By using best practices when creating bars, lines and pies, you will be able to enlighten people not only in your workplace, but also through external analysis of publicly available datasets.
Dashboards are used across the world by most people (and organizations), either in the form of a car dashboard or …
Google Analytics Dashboards: A Step-By-Step Guide Read More »
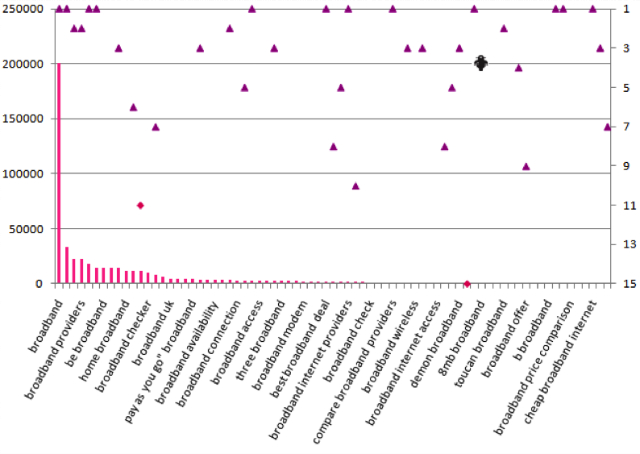
Web analytics data is worth nothing if it can’t be used in the correct way. In order for it to …
10 Best Or Worst Ways To Visualise Web Analytics Data Read More »