Colonoscopies are no fun. The exam is one of the most disagreeable screenings in medicine; but scientists have found a way to make patients “dislike it less”. The solutions is contrary to what any web analyst would include as a hypotheses to “optimize the experience”: increasing the duration of the exam.
That’s right: increasing the duration of the exam!
A study by Nobel Prize winner Daniel Kahneman assessed patients’ appraisals of uncomfortable colonoscopy and correlated the remembered experience with real-time findings. They found that patients consistently evaluated the discomfort of the experience based on the intensity of pain at the worst (peak) and final (end) moments. So why were the patients happier because of the deliberately prolonged colonoscopy? Because a few extra minutes of mild discomfort were added after the end of the examination by the doctors – making the “end moment” less disagreeable. This science is explained in Kahneman’s theory called the Peak-end rule – here is a great interview with him.
Website Exams
This is a great example on how we can sometimes jump at conclusions while analyzing data and assume that we are creating better user experiences on our online properties by simply “reducing pain” instead of “increasing happiness”. And increased happiness (you can also call this “customer satisfaction”) means more conversions and more referrals. So, how do we know that we are really “increasing happiness”? We have to do what the doctors did in the exams – ask the patients.
Voice Of the Customer (VOC) is essential to really gauge visitor experience. There are various tools and frameworks available to measure VOC – but I am here to talk about the Net Promoter Score (NPS). NPS is a 1-question survey: How likely is it that you would recommend our company/product/service to a friend or colleague? The scoring for this answer is based on a 0 (not at all) to 10 (extremely likely) scale, and a follow-up question is then presented asking the client the reason they gave that score.
Visitors who gave you a 0-6 rating are called Detractors, they are unhappy customers who can damage your brand through negative word-of-mouth. Visitors who gave you a 7-8 score are the Passives, who are satisfied but unenthusiastic customers who are vulnerable to competitive offerings. And last are the Promoters, who gave you a 9-10 score: loyal enthusiasts who will keep buying and referring others, fueling growth.
Just like any customer feedback framework, NPS isn’t perfect. But it’s simple, and it gets things done. It gets you feedback, and it opens the door to improvement. If you’re not getting client feedback from every single client, it’s time to start.
Net Promoter Score in Google Analytics

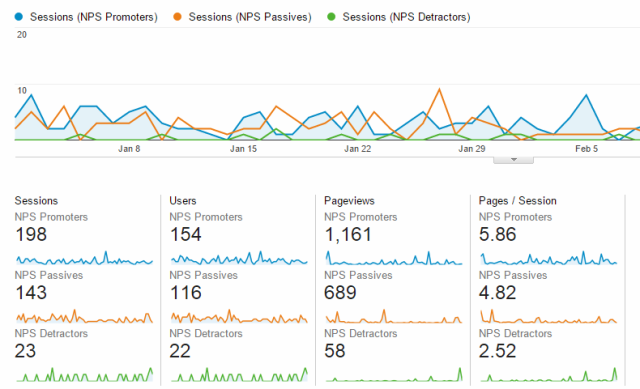
Besides the valuable insights you will get from the comments on why certain customers gave specific ratings, you can bring this information into Google Analytics and try to uncover behaviors that correlate to happiness.
The first thing to consider is to survey your customers while they are actually using your website – instead of an email message. This will allow you to gauge a more precise perception of their experience.
The survey timing is also very critical. You don’t want to survey your clients before they have had time to acquaint themselves with your site or SaaS. But at the same time, you don’t want to limit your surveys to very heavy users – because these shy away from the average and tend to be back all the time because they love your site.
I recommend using a Custom Dimension to hold the NPS rating. This will allow you to slice & dice pretty much any report to observe different behavior patterns based on their happiness. A quick way to get started measuring NPS is to use FanExam (disclosure: I am the founder), it has a hefty free plan with automatic GA integration.
Things to look for in NPS segmented reports include:
- Top content read / features used by promoters but not by passives or detractors.
- Traffic sources by type – focus investments in promoter sources.
- The new cohort analysis can also bring valuable insights.
This will also help validate if certain hypothesis intended to increase conversions are also affecting happiness.
Closing Thought
I really don’t think that if the doctors who optimized the exam for happiness started measuring Net Promoter Score with their colonoscopy exams – people would be handing out 9 and 10’s! But I am also sure that if their patients had an exam elsewhere they would definitely recommend this doctor.
In the web, it might be pretty hard to get a great score for a support website, where people come to only when they are already frustrated with your service… but you should definitely look at the trends: can you increase the score from 6 to 7? That would already represent a huge win.


