Have you ever wondered how divorce and marriage rates have trended over the last 150 years? Or what reasons husbands and wives give when getting a divorce? Fortunately these, and other questions, can be answered with data. The UK Office for National Statistics make available two extremely interesting and rich datasets on marriages and divorces, providing data for the last 150 years. Following the discovery of these datasets, I decided to uncover trends and patterns in the numbers, working with my colleague Lizzie Silvey. Two important questions were in our minds when exploring the data:
- Who wants a divorce and why?
- How do wars and the law impact marriage and divorce rates in the UK?
We discuss our findings in this article, but you can also drill down into the data using this interactive visualization that we created using Google Data Studio.
Divorce petitioners and their reasons
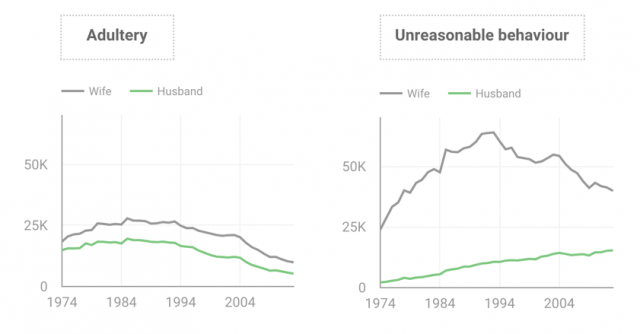
The ratio of petitioners has been stable since around 1974 (70% women and 30% men), the time at which both genders started having the same rights and divorce could be attained more easily. In the charts below we see the trends for ‘Adultery’ and ‘Unreasonable behaviour’, the two most common reasons provided (out of five possible) – each line shows the number of divorces granted to the husband or wife for a specific reason.  In order to use Adultery grounds the petitioner must prove that the partner had sexual intercourse with someone else, which might not be simple. We can see in the chart that Adultery follows the exact same pattern for husbands and wives, but analyzing the statistics further we see that, on average, 40% of the adultery divorces are granted to husbands – since only 30% of total divorces are petitioned by husbands, it seems adultery is a particularly strong reason for men to file for a divorce. The second chart, showing ‘Unreasonable behaviour’, is more enigmatic. While husbands were granted divorces in an increasing pace for behavioural reasons, and while the lines seem to be converging, there is a strange hump in the wives line. Why were wives granted a massive amount of divorces up to 1992 based on unreasonable behaviour? Could that be related to a “backlog” of cases of domestic violence (classified as a behavioural reason) that came to light after women could divorce based on those grounds more easily? Unfortunately we could not find data showing possible reasons for that.
The impact of laws & wars on marriage and divorces
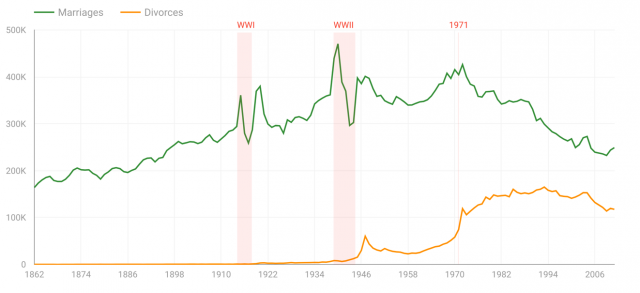
When looking at the marriage and divorce trends since 1862, there were a few clear turning points.  The wars seemed to affect marriages quite significantly. Around the beginning of World War I & II we see spikes in marriages, maybe as a result of young men wanting to vow their love before going to fight. Then, during the wars, the marriages plunged as soldiers went away, and up again when they came back home. As for divorces influenced by the wars, we can only look at World War II, as women had a limited ability to divorce after World War I. It seems the Matrimonial Causes Act 1937, which made other grounds legal (e.g. drunkenness and insanity), coupled with premature weddings (discussed above) and possibly a estrangement due to separation led to a spike in divorces starting in 1946 – who would have the heart to divorce in war times? But what seems to be the strongest influence in divorces in the history of the UK is the Divorce Reform Act 1969 (link to PDF), which came into effect in 1971. This act states that divorce can be granted on the grounds that the marriage has irretrievably broken down, and it is not essential for either partner to prove an offense. While that explains the strong increase in divorce, we could not find a strong reason for the decline in marriages at the same time – we invite possible explanations in the comments section.
Closing Thoughts
While we couldn’t bring answers as to why trends are going in a certain direction and predict upcoming changes, we believe that the data can shed new light into the British society and family relations. Hopefully with new releases of data in the future we will also be able to dive deeper and answer more existential questions. If you are interested in exploring the data further, check the interactive visualization, created with Google Data Studio, you will find more context and charts showing trends and pattern on marriage and divorce in the UK.


