A few weeks ago I logged in to my Google Analytics account and saw the little yellow number 1 besides the bell icon in the top-right corner of my screen. As usual, I clicked on it to check what it was about, I like to keep my “inbox zero” when it comes to my implementation!
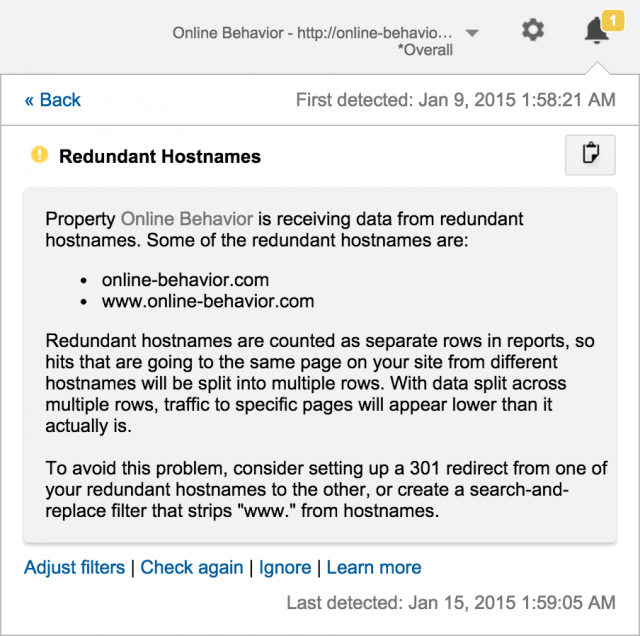
I was surprised with what I saw, as it was a pretty major issue with the website that happened as a result of a recent upgrade: the redirection from www.online-behavior.com to online-behavior.com stopped working, meaning that every single page on the website had a duplicate page. That’s bad in many ways.
Immediately after seeing the notification (which you can see below) I sent an email to my developer asking for his intervention. One day later the problem was solved. This was definitely an actionable and timely implementation insight.
The Power of Google Analytics Diagnostics
As shown through the example above, Diagnostics is a very powerful way to find out about issues with your configurations or settings, right in your face!
We all know about the importance of data quality, but how important is it, really? The answer to this question seems to be approximately US$296,477,289 only in the UK! At least that’s the estimation made by the Experian Data Quality team in a 2014 research:
86% of companies admitted that their data might be inaccurate in some way. 44% of businesses said that missing or incomplete data is the most common problem with outdated contact information (41%) being the second most problematic.
Our research also concluded that 75% of businesses are wasting 14% of revenue due to poor data quality. This equates to a staggering £197.788m wasted revenue across UK businesses.
With that in mind, it is easy to make your calculations to understand what would be the ROI of spending 30 seconds checking your Diagnostics every time you log into Google Analytics. And I write “every time” because Diagnostics is a real-time tool, it monitors your data & configuration settings on an ongoing basis; my example above shows just that. Diagnostics don’t just tell you what’s wrong today, but continually. For example, if a webmaster forgets to tag 50 new pages that launch 3 months from today, Google will keep an eye out for this.
Make no mistake, your data-driven decisions are as good as your data source, and your data source is as good as your implementation; therefore, your decisions will be as good as your data implementation – simple logic 🙂
Below I will discuss what you should be looking for and how to navigate the Google Analytics Diagnostics feature to get the most out of it.
It All Starts With The Bell (Mr. Jingles)
 Basically, Diagnostics monitors two types of implementation issues: data quality and configuration settings. Each of these has a large number of criteria being checked, some more critical than others. That’s why when you log into Google Analytics you may see three types of notifications (in order of importance below):
- Red notification: high-priority issues including untagged pages, bad filters, abundance of self referrals, (not set) in AdWords Reports, double-tagging, and others.
- Yellow notification: unresolved issues including AdWords clicks vs. sessions discrepancies, duplicate campaign parameters, auto-tagging disabled, oversized “Other” channel, and others.
- Blue notification: feature recommendations such as creating a goal, excluding internal IPs, linking to Webmaster Tools, using remarketing, using segmentation, using annotations, and others..
Note that the number on the bell will show you only the highest priority notification when you log in, i.e. if you have 6 red, 2 yellow and 2 blue notifications, you will see only a red 6 on the bell notification, but when you click on the bell you will see all of them.
The Anatomy of a Diagnostic
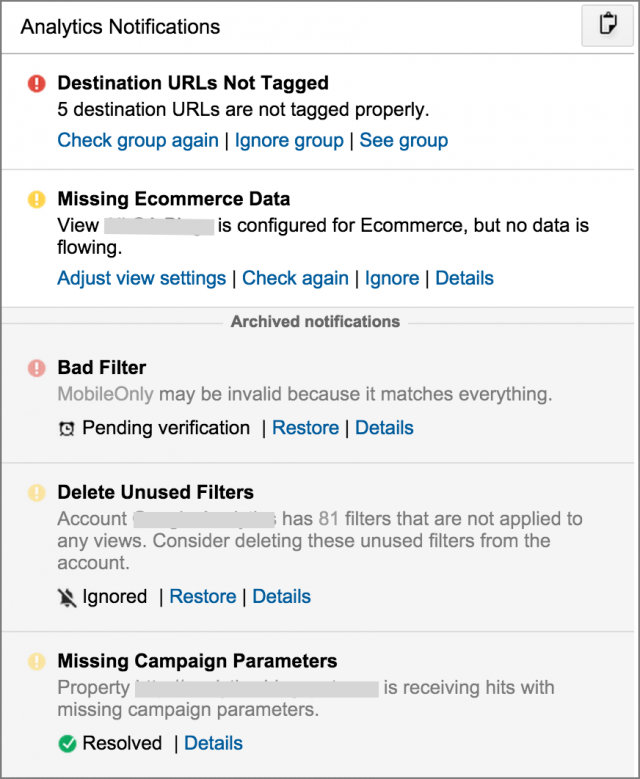
Once you click on the bell you will see an interface with all your notifications similar to the image below. You will note that there are two major sections in the Diagnostics list: Active notifications and Archived notifications. You might look at the active section as your “inbox”, or “to-do list”; the archive is the “done” or “worry later” list – so the objective here is to keep inbox zero! We will talk about each of them below.
But before that, I would like to give a honor mention to a small icon in the top-right of the screenshot below, also known as the “copy to clipboard” button. It so happens that often the person viewing the message is not the one who can act on it. If that’s the case with you, this button will make it easy for you to email notification(s) to your webmaster. Or paste into a spreadsheet to assign various owners and track its course. Or to put into a notes doc, or maybe just to copy the notifications to for the pure pleasure of doing it!
Active Notifications
This section, prominent by the white background, lists all the unresolved notifications. It also shows the priority of the notification (using the colors explained above) a short explanation of what is the issue and a list of links to help you take action. Since notifications have different natures, the types of action differ between them. Below is a list of the most common actions you can take.
- Ignore: If you are aware of the issue being reported and it is not important enough for you implement it, you can choose to ignore the notification for 1 week, 1 month, 3 months, 6 months or All time. If you do that, the notification will be archived and visible on the section below, but you will be able to restore it later.
- Check again: If you fixed the issue you can ask Google to check again in order to confirm that you’ve done it properly. This option will be available until you resolve the issue.
- Details: Clicking on details will lead you to another screen where you can read more about the notification and how to solve it. Usually in the new screen you will also have an additional link to Learn More that will often direct you to relevant resources on the Google Analytics Help Center or Developer Documents.
- Action links: Those links are present in diagnostics where there’s a setting that can be adjusted to fix the problem. For example, if you have a bad filter, you will see an “adjust filter” leading you directly to the filter, if you have a bad view setting, you will see an “adjust view setting” leading you directly to the view settings.
Archived Notifications
When it comes to archived notifications, you will have three types: Resolved, Ignored and Pending verification.
There isn’t much you can do with Resolved notifications, they have been resolved. You can only see the details about them.
Pending verification will be shown in those notifications where you can clicked on check again, explained above. Those issues are in the queue to be verified by Google, and when they are checked again they are either resolved (stay in the archive) or are going back to the active section.
As for Ignored notifications, you will have the option to Restore them into an Active notification or just check more details about them. This option has two major use cases that might be very handy:
- A teammate ignores something thinking it’s not important, but you realize it is.
- You archive something because it’s not important at that point in time. But your business strategy shifts and it becomes important in the future.
- You ignore something believing it has been implemented, but you notice later it was not (for these cases, it is always better to click on “Check again” instead of “Ignore”).
Lesson: it is always better to resolve an issue rather than ignore it!
Concluding Thoughts
In summary, Diagnostics are great, they can save you a lot of headaches and money; it will constantly monitor your data health for you and let you know if anything strange comes up. In addition, if you are not a savvy Google Analytics user, this feature will have a huge value as it will help you prioritize your development, focusing on tasks that are more important first. And another helpful touch is that it will send you directly to whatever setting you need to change, time saver!
Data quality is an issue that affects all companies, independently of their savviness, size or industry. Even if you are a data jedi, make sure to take a few seconds to check this feature, it may turn you into a hero.
Big shout-out to Matt Matyas, Google Analytics Product Manager responsible for this feature, for his comments and insights on this post.

