Not only is Data Studio now free for all (!) but, to add to our ever-growing excitement about the product, segment functionality for the Google Analytics connector is now available too!
Until now, Data Studio has provided us with the option to use filters. This functionality is equivalent to using an advanced filter within the GA interface whereby, for the data in the table or graph, the filter will narrow values meeting the condition(s) set.
Segments, on the other hand, allow for a more advanced analysis of users visiting your website. They allow you to create a subset of data by collecting users (or sessions) into that subset, which you can then query and analyse to your heart’s content.
Adding GA Segments to Components and Pages
For this example, let’s say we want to look at the behaviour of users who are browsing from a mobile device. In GA, there is a default segment already created called Mobile Traffic and this is set using this condition:
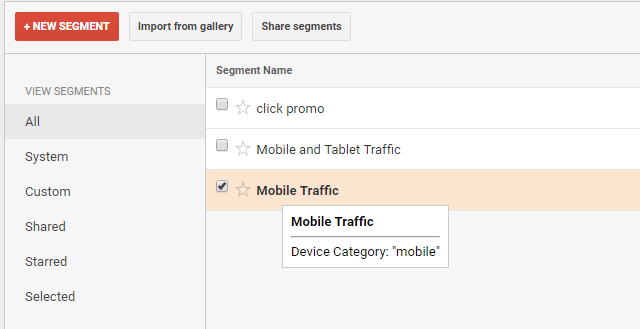
In the GA interface we can apply this segment, along with four other segments, to our reports to gain a better understanding of how our group of users (those browsing on mobile devices) behave on site. The good news is that you can now apply this same segment in the Data Studio interface as well.
To do so, you can either apply the segment at the page level or the component level. If you want the segment to apply to all components on the page, you can select Current Page Settings > Google Analytics Segment > Add A Segment. However, if you just want to apply the segment to one component, or a group of components, you will need to select the component(s) > go to the Data tab in the properties panel > Google Analytics Segment > Add A Segment.
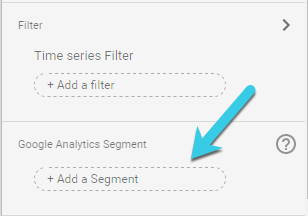
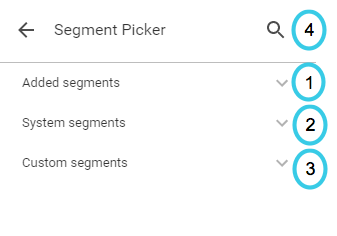
At this stage, you can now pick your segment. There are three buckets that segments can fall into (see numbers in screenshot below):
- Added segments: These are segments which have already been added to the report to another component or page (NB. this bucket won’t show up if you’ve not added any segments yet.)
- System segments: These are the default segments that are created within the GA interface. These include segments like New Users and Returning Users, which I’m sure you’ll be familiar with seeing. The Mobile Traffic segment mentioned earlier falls into this bucket.
- Custom segments: These are segments as created by you within your personal GA account… more on this later.
If you don’t want to search through these buckets for the segment you’re looking for, then just tap the search icon (4) in the top right hand corner and type in the name of the segment you’re after and it should pop up.
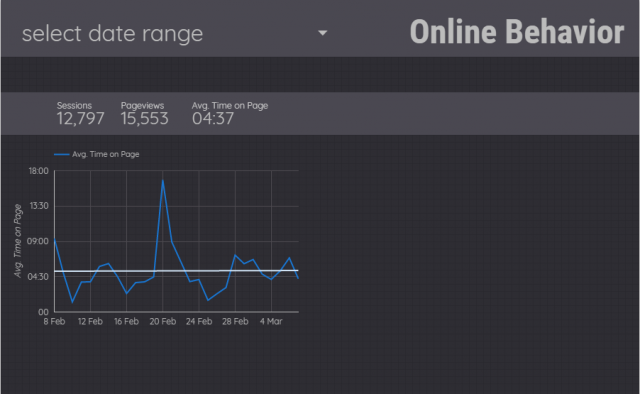
Once you’ve selected your segment and opted to add the segment to the report, this will be applied to the page or the component(s) that you’ve chosen to apply it to. At this stage, you can happily go away and analyse the behaviour of your users browsing from mobile devices.
Applying multiple Google Analytics segments to a Data Studio page
However, let’s not stop there; there is still more analysis to be done… you can set up identical components side by side in your Data Studio report in order to compare users visiting the site from a mobile device against users visiting the site from a desktop. So far you’ve added the mobile segment to the left hand components. To start with, copy the components from the left hand side and paste them onto the right hand side to get the visualisation ready. Now let’s create a desktop segment and apply this to the components on the right hand side.
To do so, you need to first create the segment within GA. You can do so using the following condition:
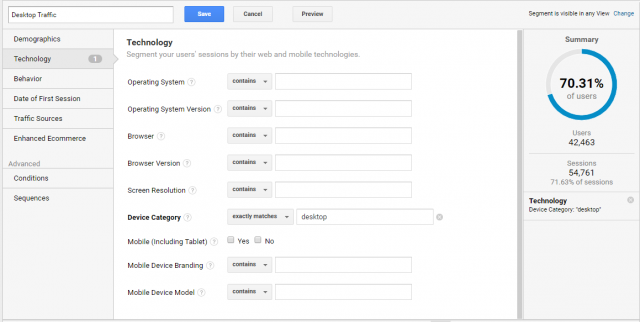
Once that’s saved in GA, you just need to refresh your Data Studio report and you can now find the Desktop Traffic segment you created under the Custom segments bucket. As noted previously, this bucket includes all the segments that you’ve personally created within your GA account.
Once again, you now just need to select the segment and add it to the components you’re interested in. Select all four components on the right hand side of the Data Studio report (using the ctrl button) and apply the segment to all four at once. Don’t forget to label the two sides of the report so that anyone viewing the report (including yourself!) will understand the data being visualised.
So now you have two different segments applied to your report! The fact that the subset of users browsing on mobile can be compared so easily to the subset of users browsing on desktop makes this a really useful feature within Data Studio. You can quickly and easily see the behaviour of these users, allowing you (if need be) to action upon the results you’re finding.
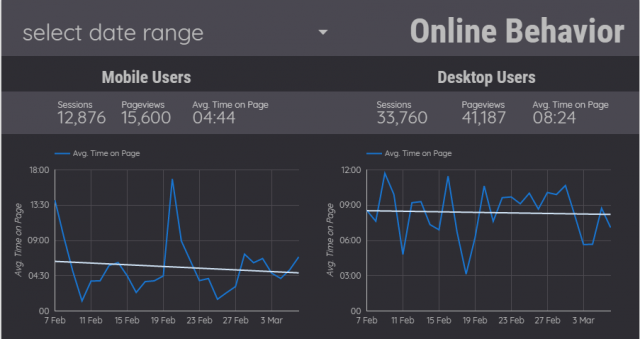
From a quick glance of my report, you can see that mobile users spend a lot less time on a page on average (4 mins 38 secs) compared to desktop users (8 mins 22). If my aim is to ensure content is keeping users engaged on site, then this might mean I need to think about what to do with the mobile version of my website. Why are users less engaged with pages when using a mobile? Is content hard to read on a mobile web browser? Are there any issues with the pages loading on mobile browsers? These are just the initial questions I would begin to ask based on a quick glance of this data…there are many more that could come out of applying these segments to further components.
Synchronising Google Analytics and Data Studio Segments
One last thing… you’ll notice a small icon next to the segment you’ve added in the properties panel.
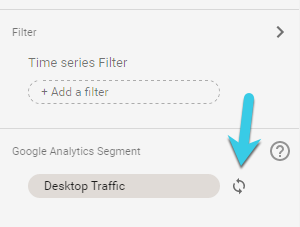
This indicates if the segment has a sync enabled. If this is enabled, any updates to the segment within the GA interface will be replicated and synced with the segment applied in Data Studio. If you want to make sure that the segment you’ve applied doesn’t change in definition, even when it’s changed in GA, then you’ll want to disable this sync. Otherwise, keep it enabled!
Happy dashboarding!
P.S. For more info on segments, head to the super helpful help centre articles on segments!


