Progressive tracking mechanisms allow you to track virtually anything on your website. Obviously, sending all the clicks and events into Google Analytics is only part of the story, you should also clearly understand what to do next with all these data. That’s why I’ve decided to share examples of dashboards that can be updated in real time and used by marketers, developers, content-managers and even analysts (!) in Ecommerce projects.
Using the dashboards you can answer lot’s of questions, we will have a closer look at these:
- What’s the efficiency of online campaigns considering offline sales?
- The conversion rate decreased. Is the problem on site or in marketing campaigns?
- Is there anything broken on a website after jQuery updates?
The described solution is determined by the following wannabes business-needs:
- Not to buy or implement anything new;
- Use Google Analytics data and familiar Google Sheets environment;
- The dashboards have to include data from different systems. Ideally, it should be collected automatically and there should also be an option for manual data collection;
- All data can be imported in CSV / JSON format any moment;
- Advanced data safety system. And a moat full of crocodiles along the perimeter.
For those who are not familiar with Google BigQuery and Google Sheets, let me start with how to organize data collection and processing.
1. Data collection
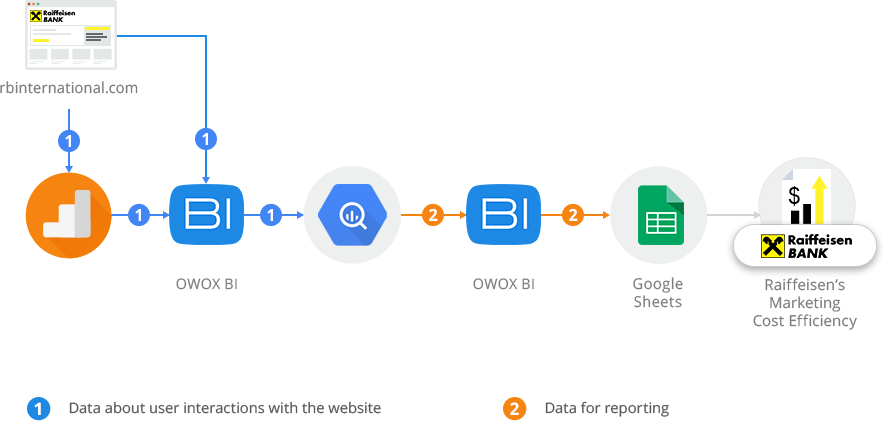
To collect and process data we use Google BigQuery. Unsampled Google Analytics data is streamed right away into Google BigQuery, and data from other services (CRM, Mandrill, Facebook, Bing) is imported automatically or manually. We chose Google BigQuery since you can import data from any service in any convenient format and mode. Plus you don’t have to bother about indicators, cores and available server space.
If you have never worked with Google BigQuery, it’s a cloud service that allows you to process vast amounts of data in just a few seconds, supports SQL-like syntax, and the payment is relative to the volume of data stored and processed. When registering you get 300 USD credit for 60 days and 1 TB of data processing free every month.
Benefits
- Easy start without contracts and servers purchasing;
- Unsampled Google Analytics data is collected in real time;
- Low cost — 5$ for 1 TB of processed data;
- The owner of data is a project owner, not connected services.
Limitations
- The service is paid;
- Only cloud version is available;
- There are no updates, only complete table rebuild.
2. Data processing
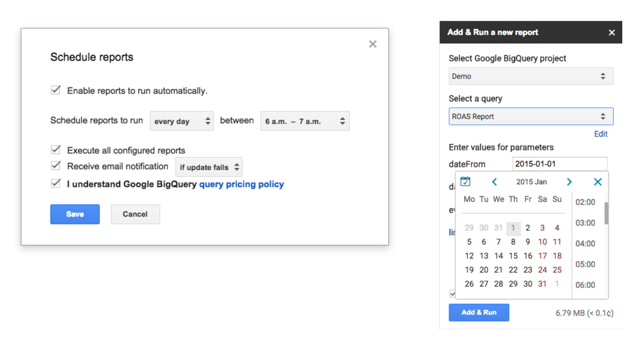
To get Google BigQuery data in Google Sheets, we run an SQL-query in the add-on and save it to use in future.
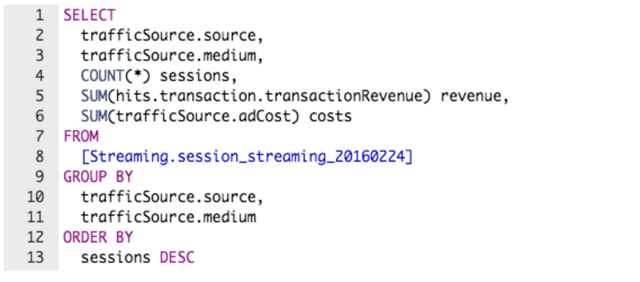
Yes, to pull data from Google BigQuery, you should use SQL. But there are no limitations for a report structure, number of metrics and your data is always unsampled. Anyway the queries are created only once. Google Sheets data is updated automatically or with the following query.
Benefits
- You can create reports of any structure and not worry about indicators in database and available server space;
- The big amounts of data are processed really fast;
- You can use SQL for queries and you don’t need to learn specialized query language.
Limitations
- To change a report you need to know SQL;
- The execution of a particularly complicated query can take a few minutes.
3. Creating reports
According to our experience, the easiest way to create reports is using pivot tables and conditional formatting.
Marketing
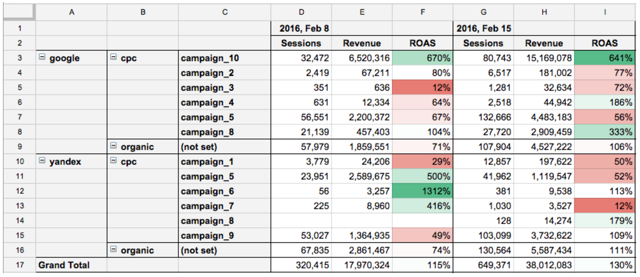
The table below represents comparison of marketing campaigns key indicators: number of sessions, revenue and ROAS weekly.
Benefits
- You can easily change the segmentation level: source, medium or campaign;
- ROAS takes into account orders, product margin and even orders at offline stores if a customer used loyalty card (or any other identificator) while making a purchase.
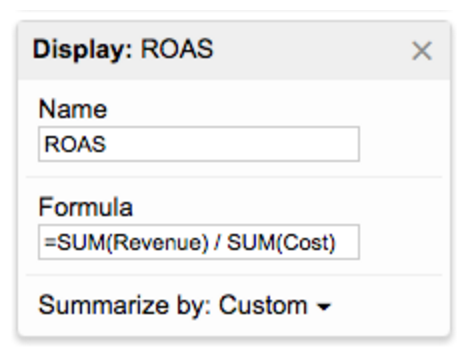
Please note that ROAS, unlike number of sessions or revenue, should be computable. Otherwise when changing segmentation, it will be calculated incorrectly.
Conversion rates
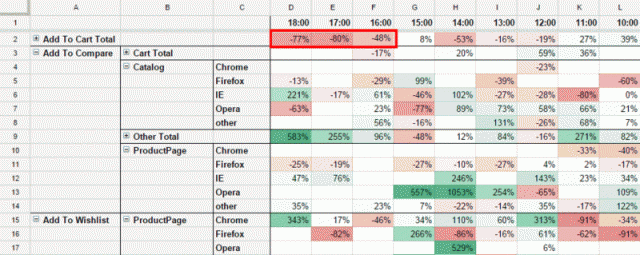
To monitor the website efficiency we define key microconvertions: add to cart, checkout, transaction. We segment each of them by page type and browser.
To easily support and update reports we follow these rules:
- One document — one department;
- One metric — one sheet (and one SQL-query).
If you need to combine a few metrics for a pivot table, you can do it the following way:

For instance, the conversion rate decreased. As a first step we check if it is related to the entire website or to particular pages. As we can see, conversion rate fell the most on product pages in Firefox browser. Developers missed this error while jQuery updating. Due to the dashboard, it was promptly identified and fixed.
Benefits
- Microconvertions analysis with segmentation by every page type and browser is available;
- You can updated information as often as you like.
Please note, that unless there is enough data for comparison, it is automatically filtered and does not distort valid data.
IT department
Besides the conversion indicators it’s beneficial to monitor key technical indicators, for instance:
- Server response time;
- Page load time;
- Share of JavaScript-errors per session.
These metrics are also recommended for segmentation by page type and browser to spot the reason asap.
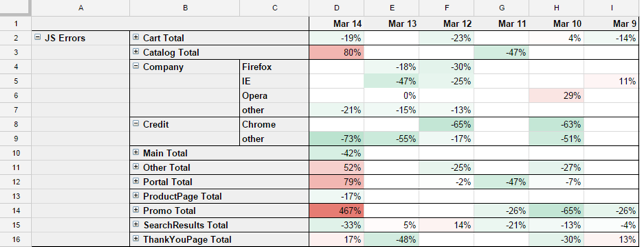
Note, that these indicators change “from the user’s point of view” and this view is more representative for this task than server side monitoring (zabbix, munin).
Bottom line
Benefits
- Arbitrary indicators and dashboards structure;
- Familiar interface and Google Sheets capabilities;
- Sharing setting based on Google-accounts and 2-step verification.
Limitations
- Google Sheets slowdown when importing 100,000+ values;
- There’s no integrated tool to notify particular indicator changes (only by using Apps Script).
So, how about the crocodiles? They are on guard duty, protecting data in Google datacenters.

