If someone were to pull open a toolbox and pick up a hammer not knowing what it is, his simplified description of a hammer would probably be “tool used to pound in nails.” That simplification does the hammer little justice for the range of utility it actually has, it can be used for a lot more than just pounding nails.
Many features of Google Analytics, like the hammer, have a range of applications outside of their initial intended purposes. We are aware of what most of these features are for, but let’s showcase some other ways to use them.
1. Inline filter to verify destination goals
When you’re creating a destination URL goal you’re essentially flagging a pageview when it is executed on a particular page, or pages, as a conversion. When building more complex goals that convert on multiple pages or creating a funnel step that can be multiple pages, you’ll need to start using regular expressions to make it work. Let’s say for example you have five contact forms on five different pages but all of these contact forms are essentially the same conversion. They all go to the same sales team and it doesn’t matter what form the user fills out.
Regular expressions can get complicated and you’re one mistake away from false positive conversions or inaccurate data. To top it off, you can’t see historically how this goal would have converted. Luckily, we have an entire report in GA that will tell you what pages are getting pageviews. In GA’s reporting section navigate to Behavior > Site Content > All Pages. Using the inline filter advanced options paste in whatever value you gave your destination goal URL.


Recreate your goal configuration and match type in the inline filter and the resulting output will be all of the pages that would match that goal. Now you can create a goal that will be 100% accurate on day one!
2. Debug your implementation in real-time
Normally it takes 24 hours for data to fully be committed to Google Analytics reporting database. If you’re lucky enough to be on Google Analytics 360, the freshness window is four hours. For some purposes that’s just fine, but let’s say for example that you’ve got a big marketing push going out tomorrow and you’ve been asking for weeks for development to put in some tracking on your landing page. Development finally put it in and they’re on the phone with you asking, “Is this good? Is this what you wanted?” 24 hours won’t cut it, you need to know now if this page change happened and if it’s collecting what you want.
This is where real time reports really shine. There’s tools to debug the website to ensure it’s sending to GA, but real time reports will verify everything is being received loud and clear. The trouble starts when you want to verify this on an active part of your site. Clicking around to trigger the tracking you want may send the data but imagine if there are a ton of other active users on the site.

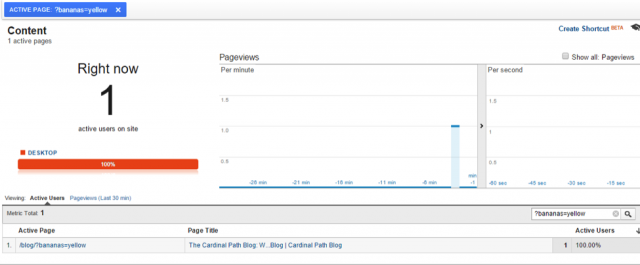
How can you be certain your actions, or sequence of actions, triggered what you wanted? First you’re going to isolate yourself in the real time reports by making you as a user completely unique and filtering by it. To do so navigate to the Real Time > Content report. Open a new browser tab to the site and page your debugging and add a unique query string parameter to the URL. It can be anything, so long as you’re the only user with it. Then in the report use the inline filter to filter by that unique aspect.


When you do so, you’ll see a little blue bubble pop up at the top of the real time reports to show you what you’re filtering by. The kicker here is so long as you stay in the real time reports that filter will persist. You can navigate to any aspect of the reports from events, content, goals, to anything else and verify the data you’re sending from the page. You can debug your implementation with no development experience needed.
3. Create engagement goals with custom segments
One of the more overlooked types of goals or conversions is user engagement. Maybe you have a website where there’s nothing for sale, there’s no forms to fill out, and there’s no purpose outside of brand awareness. You can measure success with an engagement goal to find out how much of your site your users are soaking in by creating a duration or pages/screen per session goal.
For this you’ll need to set a threshold value to either the time on site or number of pages viewed. The answer you come up with is going to be very unique to you. There is no industry standard here and the reason for this is because the length and content of a single page on any website is going to be different from page to page, from domain to domain. As the resident analytics ninja it’s your job to remove the guesswork out of the data so let’s come up with a perfect number unique to your site.
Creating an engagement goal that focuses on pages per session is essentially leveraging the page depth metric. It’s asking, how many unique pageviews should be considered a conversion? There’s different levels of engagement that would denote varying levels of success. I would say the cream of the crop in terms of sessions would be the top 10% of my users, I would love for everyone that visited the website to behave like them.
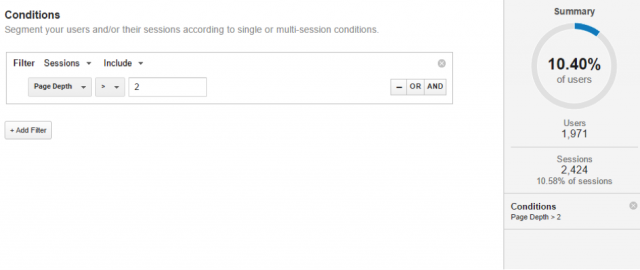
To find and define this cream of the crop, choose a 1-3 month period of time you want to benchmark against. That’s your baseline or “control” for this test. In any report at the top choose Add Segment > New Segment > Conditions. Create a single condition that filters by “page depth greater than.” Now all you need to do is keep changing the value you feed it until the percentage meter on the right closely matches the percentage engagement you’d like.

Looks like my number is 2! Jump back over to the goal configuration and create a goal with a threshold of 2 pageviews per session and you will have an engagement goal that’s tailored to your website and business objectives. You can save the segment if you’d like for future analysis but what we were really after was that percentage output in the advanced segment interface.
4. Intelligence alerts for technical problems
Depending on the size of your company or client, you may find yourself wearing a lot of hats around the office. Nothing induces pandemonium faster than the website going down. You got hired to be the marketing person and started using analytics to measure that. You put analytics on the page so now you’re considered the website developer. Since you’re the website developer of course that now means you’re in charge of the website hosting. There’s no budget to fill any of these roles with someone in a background for it let alone pay for any tools needed to upkeep.
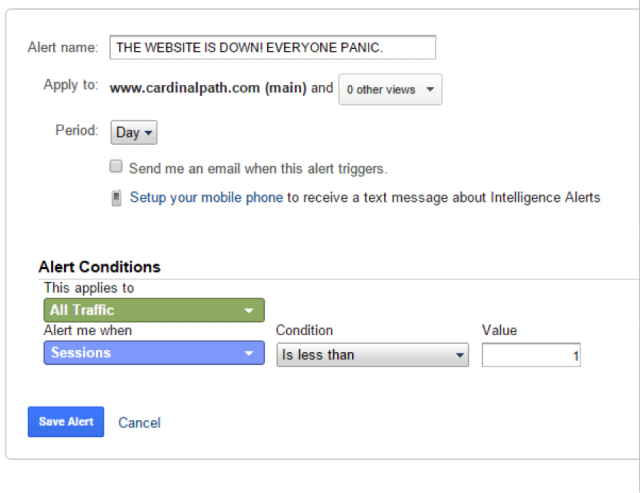
An extremely simple alert you can set up in GA will tell you when data stops coming in, typically this means because the website went down. If GA isn’t collecting data then something fell off the rails. In GA Navigate to the admin panel, select the view that collects all of your data, click the custom alerts sublink, and create a new alert.

Using the following configuration will send you a quick text message. The lowest period you can set is for “day” which works well over weekends and if you have a website you’re not on every single day. You can swoop in and save the day without having to beg for server monitoring services or software.
5. Hyperlinks in annotations
On any report with a timeline you have the ability to add annotations. These are basically little post it notes you can stick to the timeline to let others know anything of particular importance you need to share for that day. It’s a common analysis request from clients to explain peaks or valleys in the trend line and rarely is it a simple explanation. These annotations are perfect for flagging that peak or valley as important to the team or even your future self however rarely is the 160 character limit enough to do your analysis justice.
In a concept stolen right from good internet marketing, these annotations are a perfect place to drop a shortened URL to an internal report. Creating a report on dropbox, Google drive, or your favorite document repository will have all the login barriers that you need to keep the report safe and using a link shortener to that file will fit in the annotation.
Want to learn more tips and tricks for Google Analytics? Download our free ebook, Google Analytics Tricks for Conversion Rate Optimization and check out our online courses.


