Every mobile app professional today uses mobile app analytics to track their app. Yet there are some key elements in their analytics workflows that are naturally flawed. The solution is out there, and you might have missed it.
The flaw, and a fairly big one at that, is in the fact that app analytics pros sometimes focus solely on quantitative analytics to optimize their apps. Don’t take this the wrong way – quantitative analytics is a very important part of app optimization. It can tell you if people are leaving your app too soon; if they’re not completing the signup process, how often users launch your app, and things like that. However, it won’t give you the answer as to why people are doing it, or why certain unwanted things are happening in your app. And that’s the general flaw.
The answer lies in expanding your arsenal – adding qualitative analytics to your workflow. Together with quantitative analytics, these tools can help you form a complete picture of your app and its users, identify the main pain points and user experience friction, helping you optimize your app and deliver the ultimate product.
So today, you are going to learn how to totally revamp your analytics workflow using qualitative analytics, and why you should do it in the first place. You’ll read about the fundamentals of qualitative analytics, and how it improves one’s analysis accuracy, troubleshooting and overall workflows. And finally, you’ll find two main ways to use qualitative analytics which can help you turn your app(s) into mobile powerhouse.
Exploring the qualitative
Qualitative analytics can be split into two main features: heatmaps and user session recordings. Let’s dig a little deeper to see what they do.
Touch heatmaps

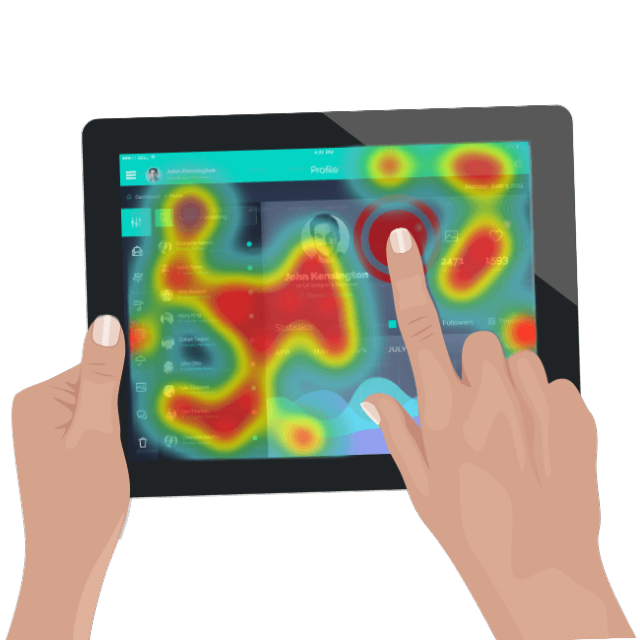
This tool gathers all of the gestures a user does in every screen of the app, like tapping, double-tapping, or swiping. It then aggregates these interactions to create a visual touch heatmap. This allows app pros to quickly and easily see where the majority of users are actually interacting with the app, as well as which parts of an app are being left out.
Another important advantage of touch heatmaps is the ability to see where users are trying to interact, without the app responding. These are called unresponsive gestures, and they are extremely important because they’re very annoying and could severely hurt the user experience.
Unresponsive gestures can be an indication of a bug or a flaw in the design of your user interface. Also, it could show you how your users think they should move through the app. As you might imagine, being bug-free and intuitive are two very important parts of a successful app, which is why tackling unresponsive gestures can make a huge difference in your app analytics workflow.
User session recordings

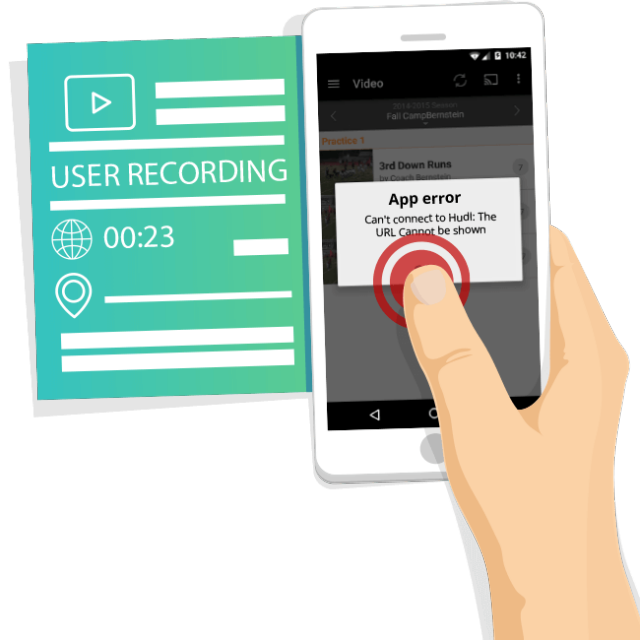
User session recordings are a fundamental feature of qualitative app analytics. They allow app pros to see just what their users are doing, as they are progressing through the app. That means every interaction, every sequence of events, on every screen in the app, gets recorded. This allows app pros an unbiased, unaltered view of the user experience.
With such a tool, you’ll be able to better understand why users sometimes abandon an app too soon, why they decide to use it once and never again, or even why the app crashes on a particular platform or device.
Through video recordings, it becomes much easier to get to the very core of any problem your app might be experiencing. A single recording can shine light on a problem many users are struggling with. Obviously, the tool doesn’t just mindlessly record everything – app pros can choose different screens, different demographics, mobile devices or their operating systems to record from. It is also important for this tool to work quietly in the background and not leave a strain on the app’s performance.
Standard workflows- totally revamped

Qualitative analytics is too big of a field to be covered in a single article. Those looking to learn more might as well take a free course via this link. For all others, it’s time to discuss two main workflows where they can be used – ‘Data-fueled Optimization’ and ‘Proactive Troubleshooting’.
Data-fueled optimization
Both qualitative analytics and quantitative analytics tools are ‘attacking’ the same problem from different angles. While both are tasked with helping app pros optimize their mobile products, they have different, even opposite approaches to the solution. That makes them an insanely powerful combo, when used together.
Employing inherently opposite systems to tackle the same problem at the same time helps app pros form a complete picture of their app and how it behaves ‘in the wild’. While quantitative analytics can be used as an alarm system, notifying app pros to a condition or a problem, qualitative analytics can be used to analyze the problem more thoroughly.
For example, using quantitative analytics tools you are alerted to the fact that a third of your visitors abandon their shopping cart just before making a purchase. You identify it as a problem, but cannot answer the question as to why this is happening.
With tools like user session recordings, you can streamline your optimization workflow and learn exactly where the problem lies. You could try to fix a problem without insights from qualitative data, but you’ll essentially be “blindly taking a stab“.
By watching a few user session recordings, you realize that the required registration process prior to making a purchase is simply too long. Users come halfway through it and just quit. By shortening the registration process and making checkout faster, you can lower the abandonment rate. Alert, investigate, resolve. This flow can easily become your “lather, rinse, repeat.”
Proactive Troubleshooting
Can you truly be proactive in your troubleshooting? Especially when using analytics? Well, if you rely solely on quantitative analytics, probably not. After all, you need a certain amount of users to actually be using the app for some time before you can get any numbers out, like app abandonment rates or crash rates. Only then will you be able to do anything, and at that point – you’re only reacting to a problem already present. With qualitative analytics, that’s not the case.
By watching real user session recordings and keeping an eye out on touch heatmaps, you can spot issues with your app’s usability or user experience long before a bigger issue arises, therefore proactively troubleshooting any problems.
For example, by watching user session recordings you notice that people are trying to log into Twitter through your app and post a tweet. However, as soon as they try to log in, the app crashes. Some users decide to quit the app altogether. Spotting such an issue helps you fix your app before it witnesses a bigger fallout in new user retention.
Not being proactive about looking for bugs and crashes doesn’t mean they won’t happen – it means they might go longer unattended. By the time you spot them through quantitative analytics, they will have already hurt your user experience and probably pushed a few users your competitor’s way.
Wrap-up
They say new ideas are nothing more than old ideas with a fresh twist, and if that’s true, than qualitative analytics are the ‘fresh twist’ of mobile app analytics. Combining quantitative and qualitative analytics is a simple process that has incredible potency in terms of your workflows and app optimization. Plus, when you understand the reasons behind the numbers on your app, you are able to make crucial decisions with more confidence.


