 This post was authored by Scott Shannon, a Senior Analyst and Google Analytics Certified Seminar Leader and by Melaine Fuentes, a Sr. Consultant of Analytics and Insights, both at Cardinal Path, a premier Digital Intelligence and Optimization firm with offices throughout North America and some of the top minds in the Digital Intelligence community.
“Half the money I spend on advertising is wasted; the trouble is I don’t know which half.”
John Wanamaker
In the digital age, everything should be measurable, from consumer behavior to the performance of advertisements. This means transparency in advertising spending is approaching unprecedented levels, and the expectation of accountability and proven ROI is coming to the forefront of marketing departments – far different from the days of Mr. Wanamaker, in which it was acceptable for a successful capitalist to waste only half of the advertising budget.
Customer Insights & Data Informed Decision Making in Marketing
The traditional mass media advertising system is being challenged by digital advertising, which has made great strides in recent history. Our ability to measure digital channels is also unfolding, and is now seducing marketers and advertisers who believe in data informed decision making. At the center of this rapidly-changing space is a familiar business constant: the customer.
Another reason why advertisers are pursuing digital strategies is the promise of new customer insights, in real time. What color cars are people building online? Which products are piquing the interest of consumers this week? What is the geographic profile of individuals who add an item to their cart, but fail to convert? What else can we learn about these customers or potential customers? Which advertisement produced the best click through rate, and ecommerce purchase rate?
Our ability to better understand the digital experience of customers requires that we measure multiple touch points with our digital assets and piece together information from a multitude of data sources. The customer experience can include any number of the following: visits to a site, paid search ads and organic search engine results, visits directed from other sites and marketing tactics such as display impressions, email marketing and social networking. It is because of this complex consumer experience that there are many ways to calculate advertising ROI and attribute “conversion credit”.
After all, a customer may be exposed to many advertisements, and may learn about your products and services on your site, and on other sites – so how do we determine which parts of the visitor experience actually influenced a given purchase?
Multi-Channel Funnels
Currently, web analytics tools like Google Analytics, CoreMetrics and Site Catalyst use a “last touch” attribution model to assign credit for conversions. What this means is the last point of interaction prior to conversion is credited for generating the online sale, or “conversion”.
Since it is possible that a consumer’s decision was influenced by multiple touch points prior to conversion, Google Analytics took the step of introducing Multi-Channel Funnels officially on August 24, 2011. This feature can be used to better understand the value of upstream advertising that may be catching the attention of consumers early and influence a subsequent conversion.
Whether you are a small, medium, or large enterprise (or private, public, or NGO), the chances are that you are doing more than one type of promotion – from email campaigns, to paid search (cpc), to social media and display advertising. Even offline channels like TV, radio, billboards, and print can be measured using free services like Google Analytics, by directing visitors to your website – a “drive to site” strategy.
So, which promotional effort is the most effective? How do your promotions interact with each other? Do people first search for you on Google based on a need, or do people hear about your products and services on Facebook or Twitter before visiting your site? Once people hear about your offerings do they buy immediately (e.g. Justin Bieber posters), or do they talk it over with a friend or partner before purchasing (e.g. vacation travel packages). How do they come back to your site a second and third time before making a purchase, or converting against a key goal?
Measurement across different channels (email, social, cpc, display, TV, print) has been notoriously difficult, until recently. Since Multi-Channel Funnels were introduced into the free version of Google Analytics, new power and new insights are in the hands of all marketers, both large and small. So, how easy is it to set up Multi-channel Funnels? Pretty easy, just complete the following five steps.
5 Steps to Get Started with Multi-Channel Funnels in Google Analytics
- Ensure your promotions are measurable (campaign links are tagged).
- Ensure Google Analytics is installed on your landing pages (tagging pages).
- Ensure you have clear calls to action and a clear sense of what you want your visitors to do on your website (what goals do you have when visitors come to your site for a given promotion?)
- Ensure your conversion goals are configured in Google Analytics (setting up goals in Google Analytics). You may also use Ecommerce conversions as well, but it is still a good idea to create a conversion funnel for the checkout process using Google Analytics Goals.
- Test the tagged links and landing pages to ensure your clicks show up in Google Analytics under Traffic Sources > Sources > Campaigns, and that your goal conversions are also registering under Conversions > Goals.
Once you have all of the above in place, launch your promotions and wait a few days for data to collect. Next, login to Google Analytics and navigate to Conversions > Multi-Channel Funnels.
Out of the box, Google Analytics will show you which promotions and channels are driving your desired business outcomes. Often this will reveal the “true value” of social media or display advertising, which are called “upper funnel” channels, because they often result in a customer’s first exposure to a company, product, or service in the longer path to purchase.
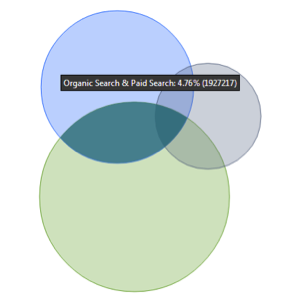 This initial exposure may be achieved by spreading general awareness in social media, or by posting advertising images and videos across the Internet using display advertising, and this may be the beginning of a longer path to purchase, or “Goal Conversion”.
The interaction of channels can be visualized with a Venn diagram (screenshot in the right), where the overlap in the circles shows the degree to which visitors had both paid search and organic search, and where the size of each sphere indicates the volume of converting online visitors coming through each digital channel at some time prior to conversion.
Things start to get really interesting when we can see the historical touch points of our customers across our digital channels. The following image shows the pattern of visitor interactions with our digital assets (the “Channel Grouping Path”), and the number of conversions for each combination, as well as the resultant ecommerce dollar value (conversion value may be a combination of ecommerce and dollar values assigned to goals).
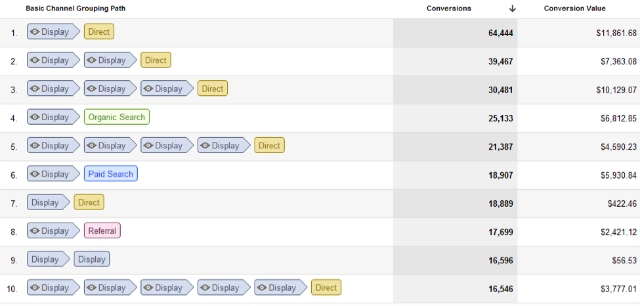
With a large volume of display advertising we see that ad impressions are common to many paths to purchase (“display” with an eye symbol is an ad impression, and “display” without an eye symbol is a click on a display ad that resulted in a site visit). After seeing an ad in the last 30 days, many visitors come back to the site using a bookmark or by typing the URL (direct). In addition we see returning traffic using search engines (paid and organic) and other websites that link to ours (referrals).
In order to see the total impact of each digital channel the “Assisted Conversions” report is the best, because it allows us to see what we thought was true prior to the Multi-Channel funnels reports existed and the degree to which we were wrong (screenshot below). The “Last Touch Interaction Conversion Value” column is the “original” last touch attribution model, and the columns labeled “Click Assisted Conversion Value” and “Impression Assisted Conversion Value” each reveal the history of the visitor experience, and the real influence of each channel.
In the example below we see that display advertising would have been seriously undervalued using a last click attribution model – at only 8% of the click assisted dollar value, and at less than 1% of the impression assisted dollar value (impression assisted being the maximum measurable value of display advertising in this case).

Comparing the last interaction and the click assisted conversion values we can quickly see which channels were being undervalued, and also which forms of advertising tend to lead to immediate conversion. In this example, paid search has a higher last interaction value than assisted, which is important to know when determining your advertising channel mix over the course of a large marketing campaign.
Attribution Modeling In Google Analytics
To further understand how various marketing programs are working together Google Analytics provides an Attribution modeling tool that allows for building, customizing and comparing attribution models. Attribution modeling is in many ways the “Holy Grail” in fine-tuning marketing future marketing activities. This feature allows you to rapidly compare attribution models, and ultimately tailor your preferred attribution model to fit your business needs the best. There are four huge benefits to using this feature:
1. No Additional Tagging
Much like Multi-Channel Funnel reporting, attribution modeling does not require additional tagging or implementation, and is currently available with Google Analytics Premium Edition (Editor Note: This feature is now in public beta for all Google Analytics accounts, including the standard version).
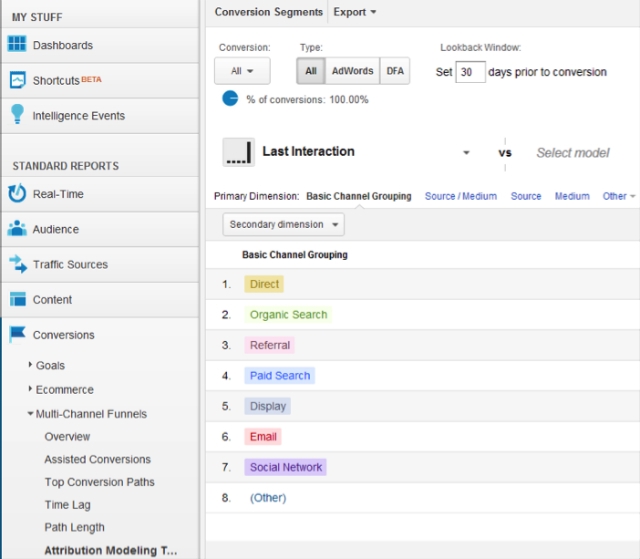
2. Easy To Compare
The ability to view up to three different attribution models side-by-side, and use the percent change to measure variance across channels, sources, campaigns and even specific keywords.
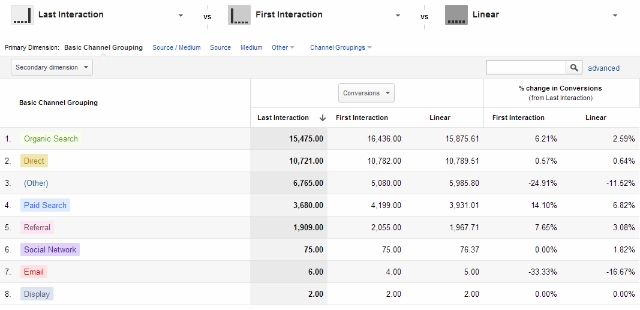
3. Customizable
The custom model builder allows credit weighting based on specified rules including site engagement and type of interaction.
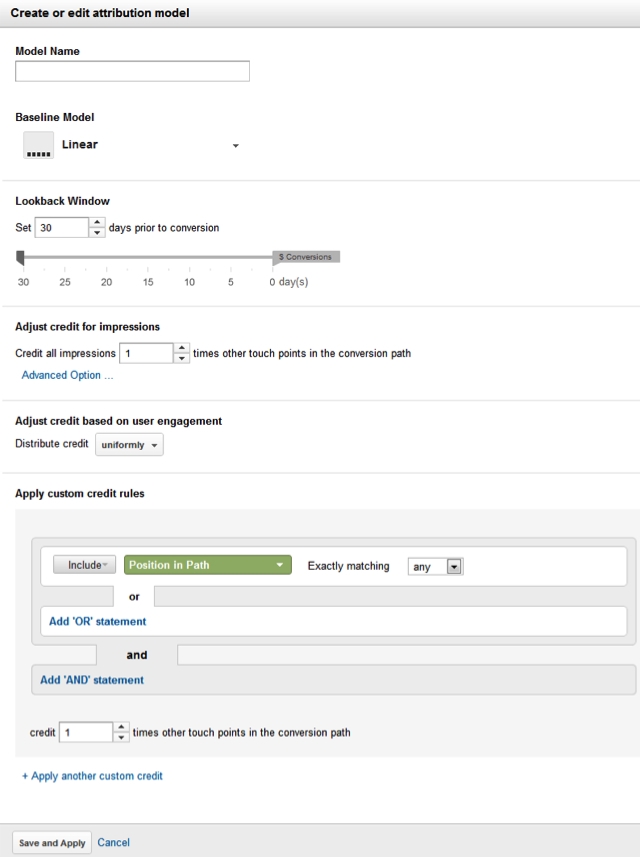
Any of the “out of the box” attribution models can be used as a starting point for building a custom attribution model. As explained on the official Attribution help article, the default models are:
- Last Interaction model: attributes 100% of the conversion value to the last channel with which the customer interacted before buying or converting
- First Interaction model: attributes 100% of the conversion value to the first channel with which the customer interacted.
- Linear model: gives equal credit to each channel interaction on the way to conversion.
- Time Decay model: most heavily credits the touch points that occurred nearest to the time of conversion.
- Position Based model: allows you to create a hybrid of the Last Interaction and First Interaction models. Instead of giving all the credit to either the first or last interaction, you can split the credit between them. One common scenario is to assign 40% credit each to the first interaction and last interaction, and assign 20% credit to the interactions in the middle.
The advanced options under “adjust credit for impressions”, allows us to weight all display advertising impressions, and apply an even greater weight if the impression occurs X minutes in advance of an online visit that ultimately converts. This means that we decide which ad exposures will be valued more based on what we believe makes the most sense.

4. “Rapid prototyping”
Custom attribution models can be created in minutes and viewed within the interface for comparison against all the other attribution models. “Rapid prototyping” is the most compelling feature of the custom model builder, because it allows us to test and compare various models and learn.
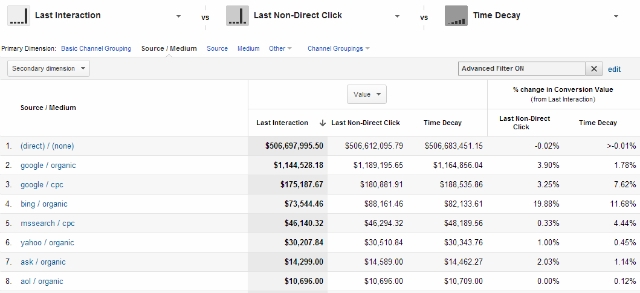
Attribution modeling is the Holy Grail for advertisers, because it allows us to weight different touch points visitors have with your Website according to what makes the most sense for a given business or marketing initiative.
Closing Thoughts
In the digital age everything is measurable, but it is important to “bake-in” measurement when starting to plan an advertising campaign. We simply have more options today than we had in the pre-digital age… and no longer should we accept that half our spending cannot be measured, because it can. Using systems like Google Analytics Multichannel Funnels, and attribution modeling allows us to reclaim control over our ROI, and our ability to effectively use these new measurement tools results in a competitive advantage, and greater efficiencies in marketing spending.
Learn more about Attribution models in this Tutorial Video


