How often do you browse your website and think to yourself: “I wonder how often people visit this page and how successful it is?” If you care about your website content you probably ask yourself this kind of questions very often…
That’s why the Google Analytics team recently released a Chrome Extension that allows you to get detailed information about each page of your website while you browse it. Below I will go through some of the extension’s features and how to use it to get a better idea of what is going on in your website.
In order to use the extension you will need any kind of Google Analytics permission to the website you are analyzing, a Chrome browser and the Extension (download here). Once you have those three, you can click on the Google Analytics icon on your browser while browsing your website (the icon is usually found on the top right corner of the page). BAM!
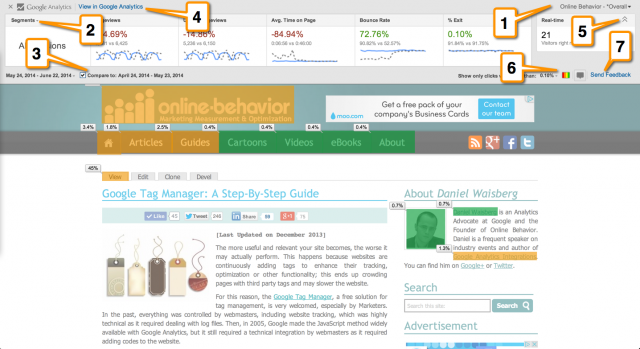
Below is the extension’s interface map with all its functionalities followed by an explanation of each.

1. Choose Your Google Analytics Account
First things first… choose the right property/view. In this drop down you will have a list of the properties you have access too where the default URL matches the URL you are currently browsing.
2. Analyze Segments
As Avinash Kaushik once said: “Segment or die” – and this was no exaggeration! Businesses that want to survive online must segment like crazy in order to understand their customers. In this drop down (#2 on screenshot above) you will find all the Segments you have created on Google Analytics. Here, you can look at how each page is performing for different segments.
3. Compare Time Ranges
When analyzing data, looking at trends is an important technique, you should never analyze a single data point. And while watching trend over time is usually a great thing to do, sometimes you want to compare summer to summer (for example). Using this feature you can do just that.
4. “View in Google Analytics”
There is only so much you can do with an extension a few pixels high. Sometimes deeper analysis require more advanced tools available only in the full application. This link is extremely helpful in that it takes you directly into the data you are looking at, making the transaction between the extension and the full Google Analytics interface very smooth.
5. Minimize The Extension
As you will notice, the extension takes quite a lot of real estate, so if you are not in the mood for analysis you might choose to minimize it. You will notice that you will still have a small box telling you how many visitors you have in the website right now. I never get tired of looking to it!
6. Visualization Types
This option will let you choose whether you want to see bubbles, colors or both in the page you are looking at. This will help you visualize how often and where your customers click on specific page links.
7. Send Feedback
Self explanatory 🙂
Closing Thoughts
Hopefully this article helped you understand the new Google Analytics Chrome extension, and hopefully it will help you understand your customers in a better and faster way.


